

The news has been very busy for the last few weeks, since after the Ryzen 7000 from AMD which arrived at the end of September, it is now the 13th generation of Intel Raptor Lake processors which is unveiled today. Today we have the chance to offer you the test of the i9-13900K but also the i5-13600K that we received via the press kit sent by Intel France. We will try to get our hands on an i7-13700K in the coming weeks.
This new generation is accompanied as always by the arrival of new chipsets. Here, Intel has already announced the Z790 chipset which follows the Z690 with which it shares many characteristics. Asus has sent us a copy of its high-end model with its ROG Maximus Z790 Extreme in DDR5 and the ROG Strix Z790-A Gaming Wifi D4. These two motherboards will benefit from a dedicated test in the coming days.
 Thanks to Intel and Asus for providing the processors and the motherboard. [nextpage title=”The Intel 13th Gen press kit: “] Before starting our tests and getting into the heart of the matter, we wanted to come back to the components of the press kit received from Intel. As a reminder, we received a press kit containing a copy of the Intel i9-13900K and i5-13600K processors. To test them, we will use the ROG Maximus Z790 Extreme motherboard which will be the subject of a dedicated article in the coming days, as well as the ROG Strix Z790-A Gaming Wifi D4.
A splendid Press Box:
A quick word on the packaging proposed by Intel for the launch. Who says launch of a new platform as well as processors, often says for the journalists, the arrival of samples. So, in addition to the Z790 motherboards and new DDR5 kits, we received the Intel press box. One thing we can already say is that Intel always offers great packaging!


So we received a box with dimensions of 280 x 280 x 45 mm and stamped with the new logo of Intel. Let’s see what is hidden inside this box that opens from the front and hides two drawers.


The first element that jumps out is the reproduction of the die of an i9-13900K with its 8 Performance cores and 16 Efficiency cores inserted in a transparent support. It is really a very nice reproduction that will end up perfectly as a decoration in our lab next to the i9-12900K.


On the other side, we find a table that includes the three processors of the 13th generation that makes up the current range. No doubt that others will come to complete it in the weeks to come. In the right drawer, two Raptor Lake processors are inserted.


Yes, it is not one but two processors that we received and we are equipped with an i9-13900K and an i5-13600K for our tests. [nextpage title=”Raptor Lake Architecture: “] Intel keeps with Raptor Lake a “hybrid” architecture since it mixes two types of cores. We still find the P-Core and E-Core. We will see that in this 13th generation, Intel has doubled the number of E-Core. Of course, they have different roles. The first ones, the Performance ones , are designed to perform tasks requiring computing power and the second ones, the Efficient ones, for what is more similar to office automation or background tasks. Now, the two types of cores will work together depending on the task requested.
The i9-13900K, Intel’s new flagship:
This is the one that will proudly carry the flag of Intel. It is equipped with 8 additional E-Core to have 8 P-Core and 16 E-Core for a total of 32 threads . The maximum frequency can now wait for 5.8 GHz which should offer a gain of 15% on single thread applications and 41% on multi threads. This processor will also be available in “KF” version but will not use the iGP (Intel UHD 770).


Intel will be launching the i7-13700K(F) as well as the i5-13600K(F) simultaneously. In addition to seeing their number of E-Core doubled compared to the previous generation, the operating frequencies are also revised upwards. These six new processors will be available on October 20th, that is to say today.


Intel is once again putting overclocking in the spotlight with a new version of its Extreme Tunig Utility (XTU) software. This one will now allow to use the 1-Click Overclocking as well as the possibility to modify independently the frequency of each core, either P-Core or E-Core. The idea is to make it easier for beginners to get started.


The power consumption also increases which is quite logical since the number of E-Core increases as well as the frequency. However, according to the slides, it is still controlled. We will judge it during our test against the previous generation but also against the new Ryzen 7000.


Here is a summary table where we added the Alder Lake processors so you can see the differences with these new Intel Raptor Lake.

Z790 chipset, retained LGA-1700 socket and backwards compatibility:
Who says new processors says new chipsets at Intel. At first, it is the Z790 chipset that will be available. Good news because this one keeps the LGA-1700 socket as well as the backward compatibility. In other words, you will be able to use an i9-12900K on the Z790 chipset and conversely, an i9-13900K on the Z690 chipset. Intel will continue to support DDR4 on this chipset but this should be the last time since the switch will be made definitively to DDR5 in 2024. [nextpage title=”The test configuration: “] All the results that you can discover in the following pages have just been updated in September. We have replayed all the processors at our disposal in order to have results realized with the latest BIOS from the manufacturers as well as the latest drivers, especially for the chipset, be it the Z690 or the X570.
The question of the memory kit:
Yes, which memory kit should we use for our comparative tests? This is a question we asked you on our Discord. Whether it is for DDR4 or DDR5, we are on memory kits composed of two 16 GB strips for a total of 32 GB. For our tests using DDR4, it is a Corsair Vengeance LPX kit clocked at 3733 MHz in 18-22-22-42. For the AMD platform in DDR4, the FCLK is 1866 MHz in order to keep a 1:1 ratio. The rest of the BIOS settings are in auto mode.
For DDR5 on the Z690 platform, we used our Teamgroup 6400 MT/s CL34 kit which we set to 6000 MT/s in 30-38-38-96. Why this choice? The kit delivered by AMD for the tests on the X670E chipset is a GSKill Trident Z5 NEO 6000 MT/s in 30-38-38-96. So we have two kits with almost identical performances on the two platforms AMD X670E and Intel Z690. Consequently, on the Z790 platform, we will also use the Teamgroup kit at 6000 MT/s in 30-38-38-96. The motherboard used will be the ROG Maximus Z790 Extreme which we will come back to in a few days for a dedicated test.


Here is a summary table of the four configurations we used for these comparative tests. Each test is of course performed several times to ensure the accuracy of our results.

Finally, as far as the operating system is concerned, we chose Windows 11, which is the latest version 21H2 Build 22000.918. You should know that we noticed that for benchmarks, overall the results are always slightly better under Windows 10. [nextpage title=”The frequencies reached?”] As with all new processor tests, our first idea is to check if the announced frequencies are actually reached. To do this, we will use the Cinebench R23 benchmark. Two cases will be used: a single core bench and a second one in multi core. The idea is to be able to judge the frequency reached and thus, to compare with what was announced by Intel in its slides.
Remember that the Boost frequency in bench is different depending on the processor. Be careful, as Intel points out, when we talk about Max Turbo frequency, it is the maximum frequency that can be reached by one of the processor’s cores executing a single-core workload(mono-thread). This frequency varies according to several factors: the load, the cooling system and therefore the temperature of your processor. This is a notion to keep in mind. Here are the frequencies we should reach on a single core during our run under Cinebench R23.  First step, we leave everything in AUTO in the BIOS except the XMP profile that we load in order to have a frequency of 6000 MT/s in 30-38-38-96 for our memory kit. We don’t make any other changes in the BIOS.
Testing with the i9-13900K:
Here we go with the strongest processor, the i9-13900K. As you can see, we opened several windows to check the frequency and the temperature. The options in our BIOS have been left in AUTO but we will talk about it again in the power consumption section because it has a significant impact on it.
 In single core, we can see that core #5 reaches a frequency of 5800 MHz which corresponds to what is announced by Intel. We can see that the temperature of the two cores that alternate at 5.8 GHz have a temperature of 65/66 °C.
 When the 24 cores of our i9-13900K are solicited, the frequency is fixed on the P-Core at 5.5 GHz and at 4.3 GHz on the E-Core. As for the temperature of the hottest P-Core, it is 87°C and on the E-Core 69°C. Let’s not forget that we are equipped with a custom cooling loop of 480 mm. So if you choose this processor, it will be at least a very powerful AIO of 280/360 mm.
Test with the i5-13600K :
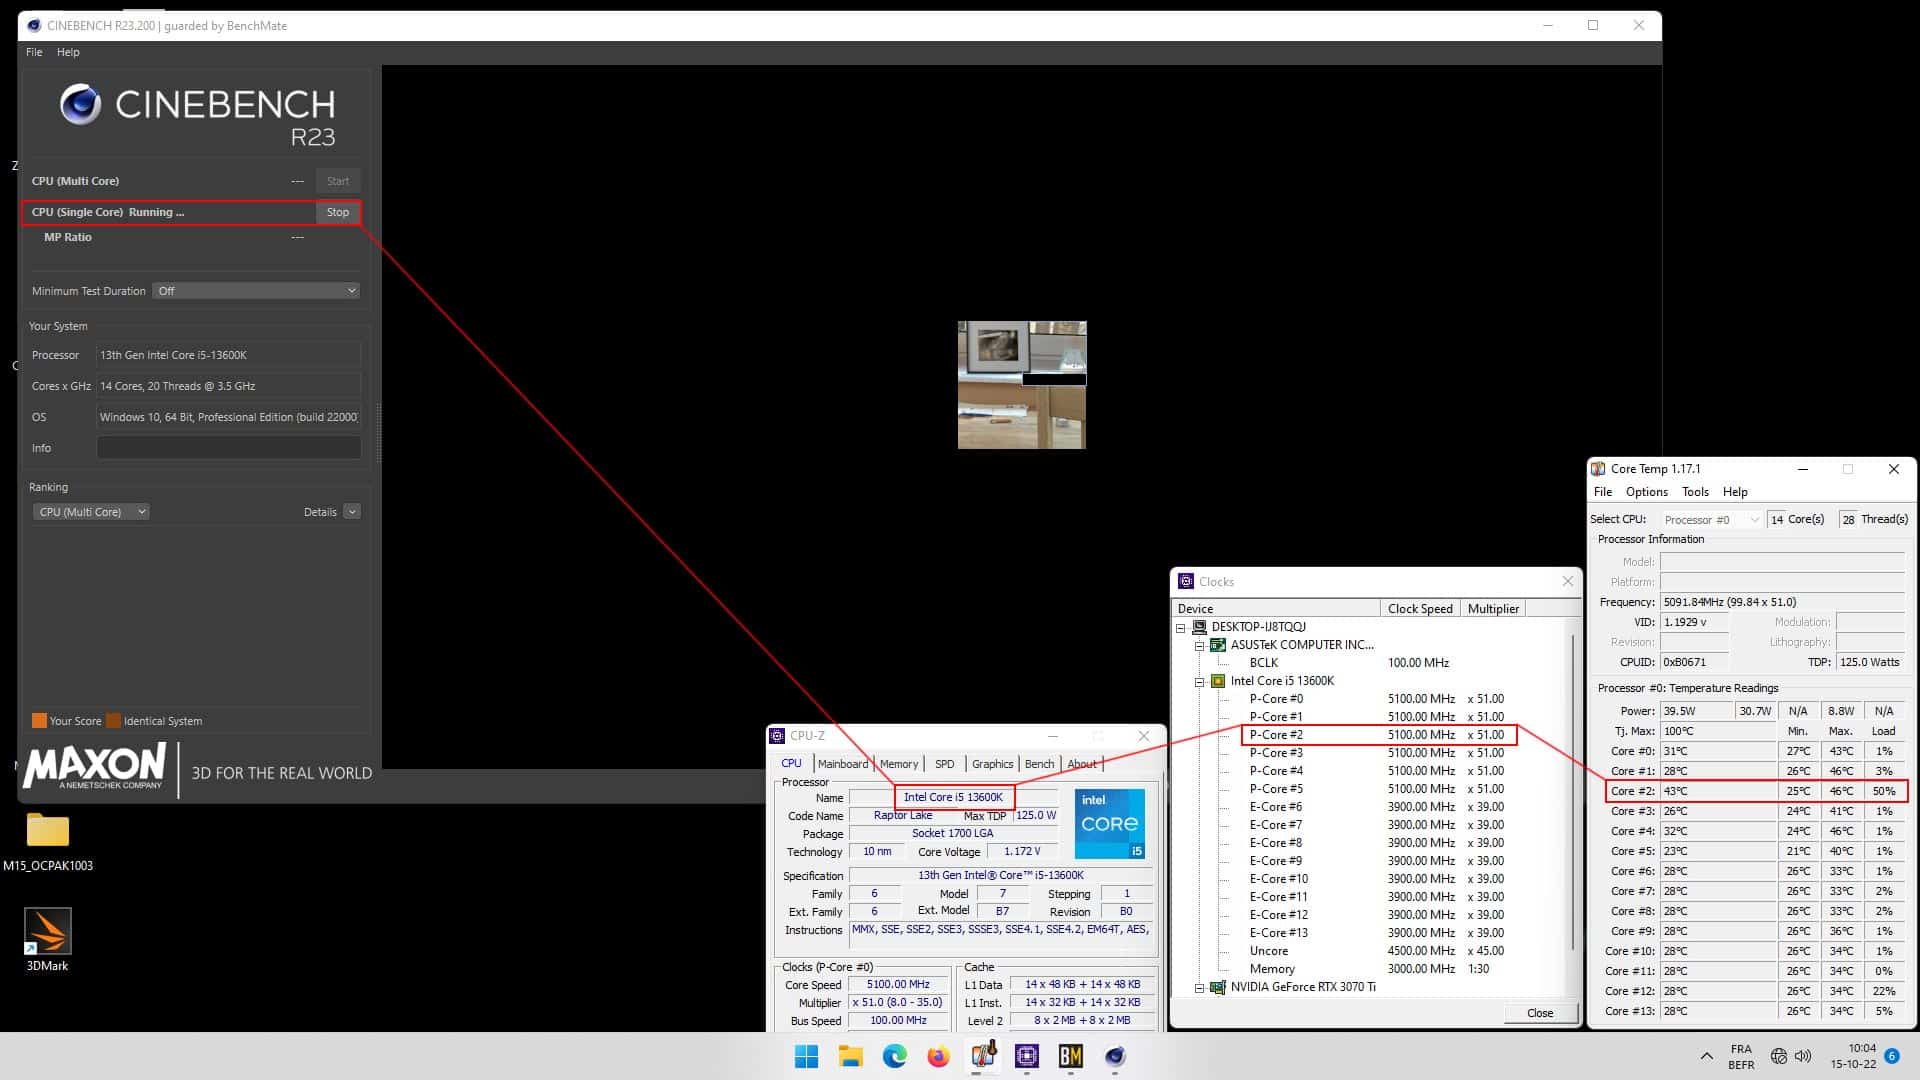
We continue with the i5-13600K and its 6 P-Core. In single core, we can see that the core #é reaches a frequency of 5100 MHz but strangely the other cores also remain at this frequency. It seems that it is the AUTO settings of our BIOS that remove the limits of Intel since the temperature is correct. The temperature of the requested core is 46°C.
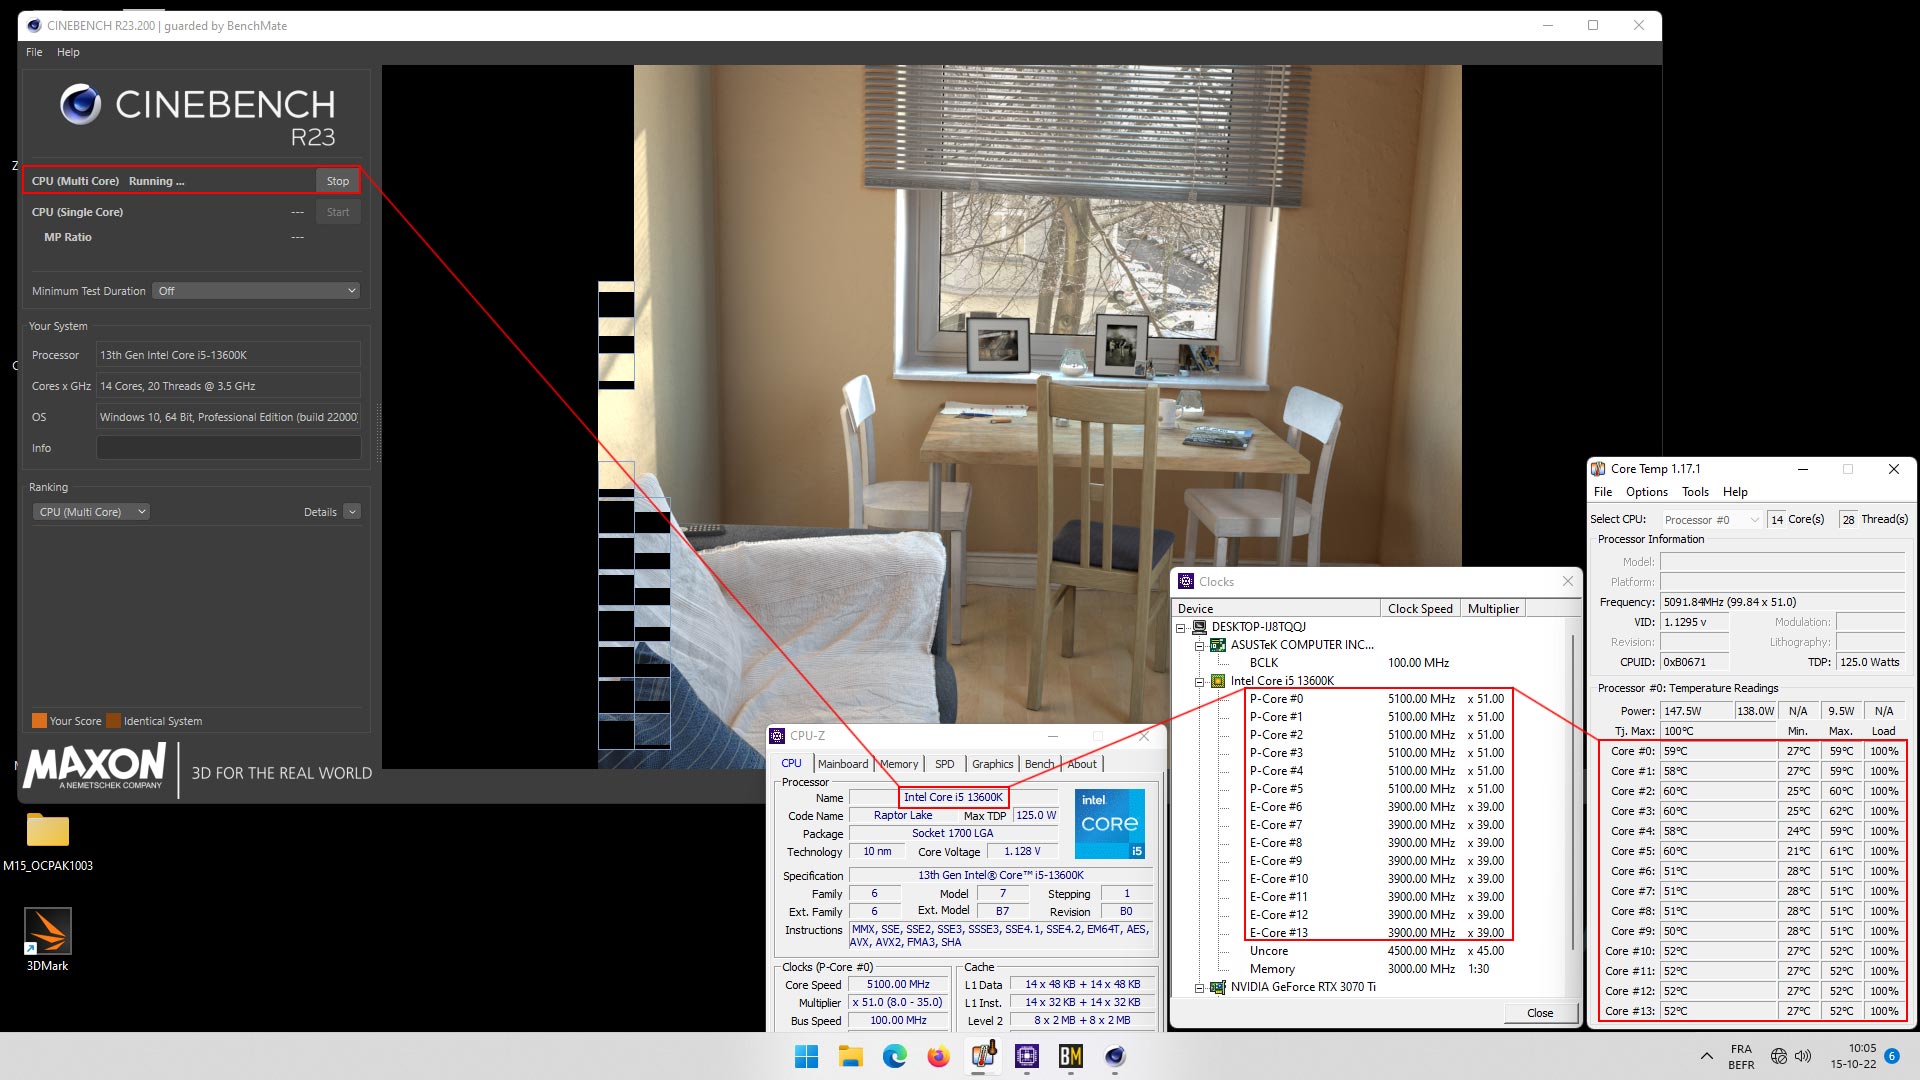
 When all 6 cores are used, the frequency is always 5.1 GHz, although we thought it would be lower. Finally, we will not complain since the temperatures are excellent with the hottest P-Core at 62°C and the E-Core at 52°C.
 We can’t wait to test this i5-13600K in overclocking since it should become a very interesting processor on this new generation. Here we are, our two processors are perfectly operational, we can serenely start our comparative tests. [nextpage title=”Cinebench, Geekbench and CPUZ benchmarks:”] Let’s start with an essential processor benchmark, the Cinebench series. We chose Cinebench R15, the R20 version, which is also more and more used and finally Cinebench R23, the latest one. The scores will be given in Single core and Multi core. This means that the benchmark tests the performance on one of the processor’s cores and then on all the available cores.
To do this, we will use Benchmate which has just been updated to version 10.11.2 and can be downloaded here. The advantage of Benchmate is that it already contains a whole series of benchmarks and moreover, it is recognized and certified when you want to encode your results on the Hwbot site.
Cinebench R15 Single Core and Multi Core:
A benchmark that is very much used by overclockers in order to compare the performance of the processors between them. It also allows you to judge the optimizations of your OS as well as your memory kit by setting a frequency and trying to score a maximum of points. Even if it is less used today with the arrival of R20 and R23, it remains a reference to compare CPUs between them since it is one of the first benchmarks used by the community. 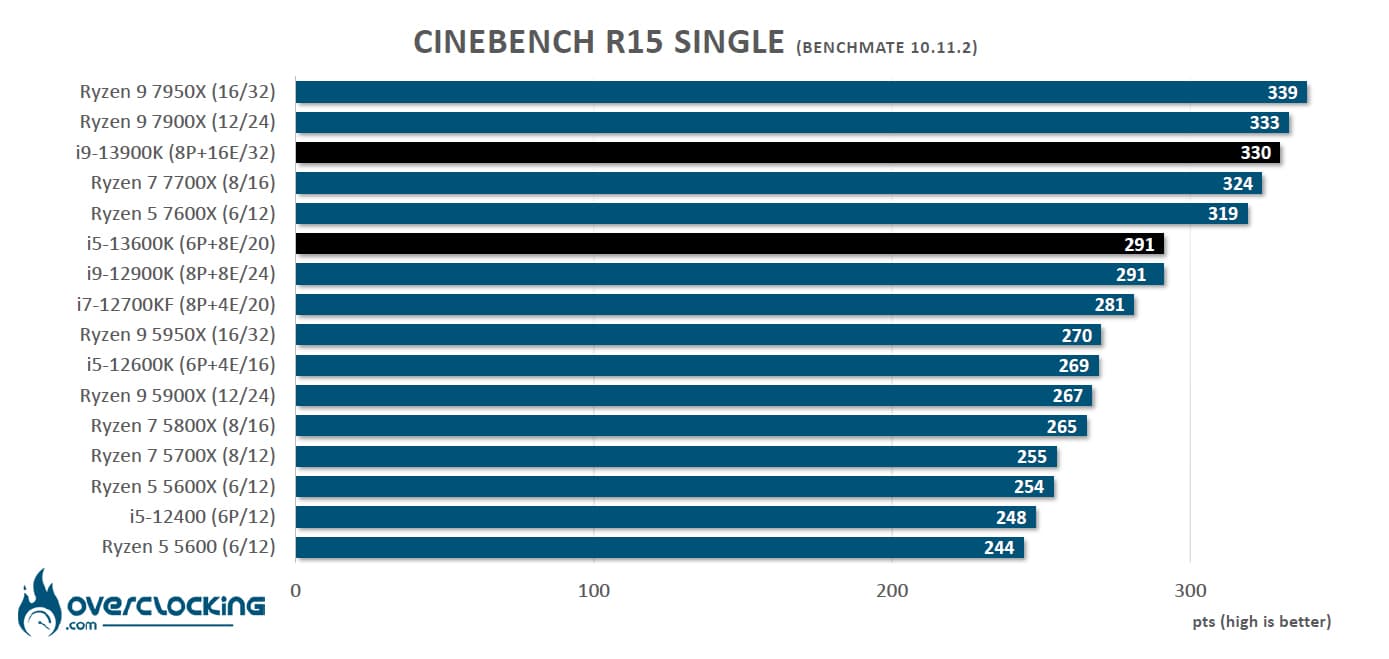 First benchmark, indeed not so young anymore, and the advantage remains with the two Ryzen 7900X and 7950X even if the gaps are quite small. We can judge the improvement against the 12900K as well as the performance of the 13600K which matches this processor.
  In multi-threaded mode, the results are slightly different and this is logical. It is mainly the total number of cores that will determine the score as well as their frequency. The 7950X still has the edge by a small margin thanks to its 16 cores (performance) compared to the combination of 8 P-cores and 16 E-cores of our 13900K. The 13600K becomes the most powerful six-core processor, even surpassing eight-core models.
Cinebench R20 Single Core and Multi Core :
Cinebench R20 offers similar tests to the R15 version with SingleThread and MultiThread. Freshly landed in March 2019, it offers a more complex benchmark than the R15 version which had become a bit too easy for CPUs with many cores. Cinebench R20 requires eight times more computing power than the R15 version, and four times more memory. It can already be more like a stress benchmark since it forces your CPU to be stable for the duration of the bench. 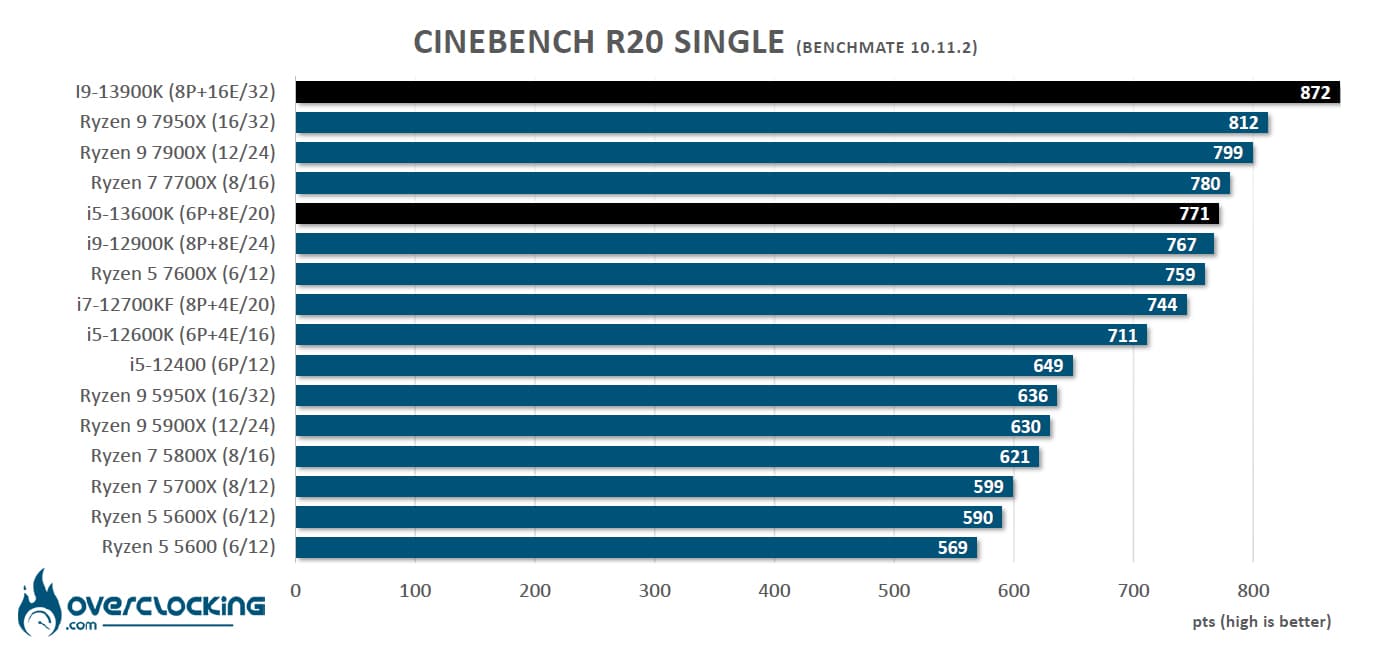 Cinebench R20 is more recent and is more beneficial to the Raptor Lakes, which are in the top five places with the 13900K taking a large lead over the 7950X here.
 In multi-core, it’s the number of cores that speaks for itself once again, even if here it’s the 13900K that takes the first place by a short head. Let’s also note the excellent performance of our i5-13600K.
Cinebench R23 Single Core and Multi Core :
How does this new version differ from the previous ones? First of all, it is more realistic when it comes to the score obtained depending on the processor used. As a reminder, Cinebench only tests the capabilities of your processor in single-thread or multi-thread. But the main difference is to propose a benchmark which by default will last 10 minutes! The idea for MAXON with Cinebench R23 is to propose a benchmark that will allow a certain stability in terms of temperature and boost frequencies. We will test here the fast version.
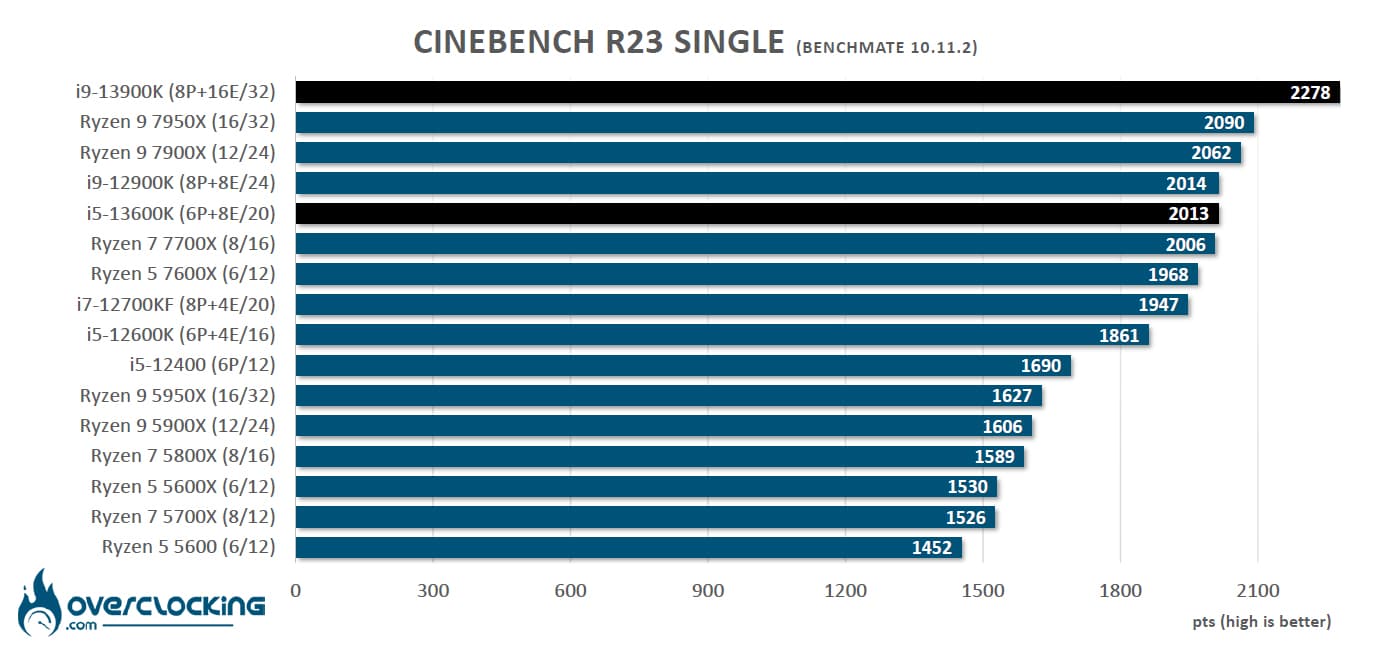 The Cinebench are similar but with the i9-13900K widening the gap leaving the Ryzen 7950X at 188 points. The i5-13600K competes with the 12900K and falls one point short of a perfect tie.
 In multi, we don’t change the profile of the graphics with a breathtaking score of the Raptor Lake 13900K which becomes the first processor to pass the 40K mark in Cinebench R23.
Geekbench 3.4.4 Single Core and Multi Core:
This is a benchmark available in several revisions, version 5 is in fact increasingly used in recent months and is in fact often used for CPU performance leaks. It allows to obtain two scores: one in single core and the other in multi core. The version used for the tests is 3.4.4 and 5.2.5. Attention, in order to take full advantage of these two benchmarks, a license is necessary and we realize the bench in 64-bit.
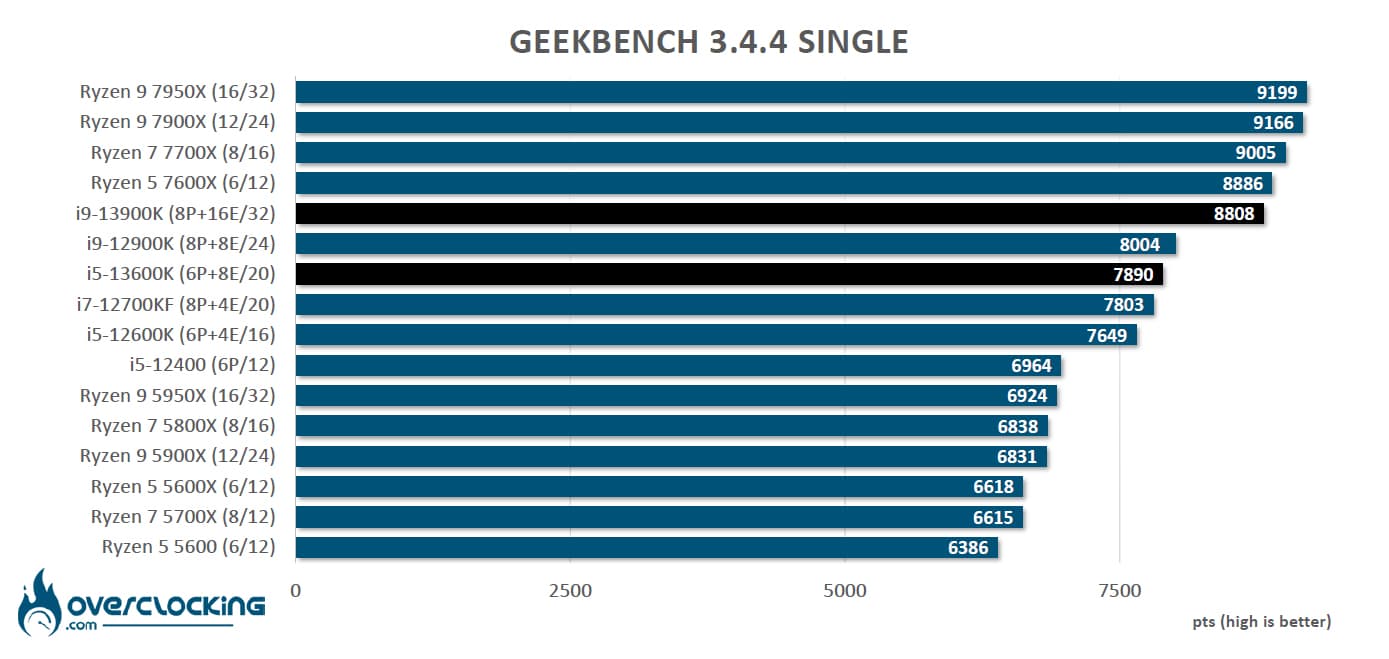 The trend we have noticed in Cinebench is not quite confirmed in Geek Bench 3 since the 4 Ryzen 7000 get the best scores in single core, which is quite surprising.
 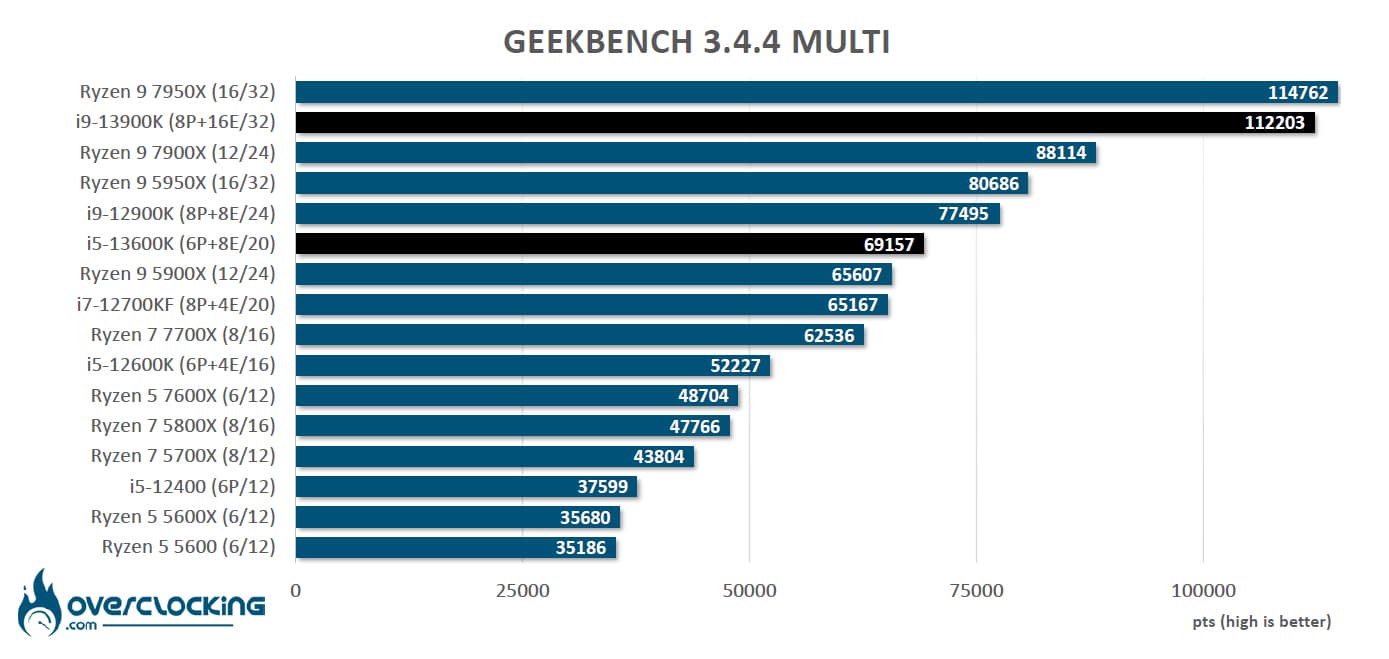 In the multi-core version, it is once again the two high-end processors from AMD and Intel that are in confrontation to take the first place with the advantage to the Ryzen 7950X.
GeekBench 5.2.5 Single Core and Multi Core:
The latest version of the GeekBench software, it is increasingly widespread and used by journalists. It allows, like the version above, to do memory and processor performance tests. We decided to add this additional benchmark but why? The CPU benchmark uses new tests that more closely simulate the tasks that processors face with recent applications. Geekbench 5 also increases the memory used in the benchmark to better reflect the impact of this parameter on the CPU results.
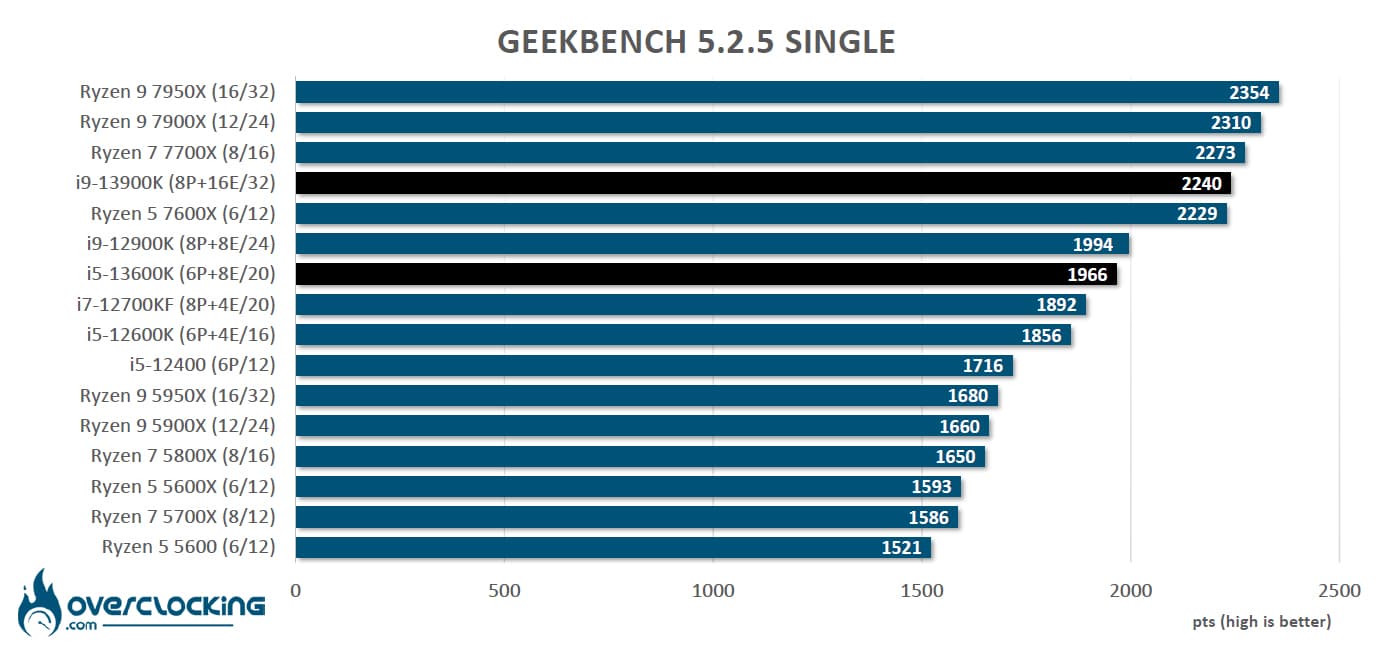 Doesn’t it seem like déjà vu? Here the Ryzen 7000s are once again at the top of the ranking with our 13900K climbing one place above the 7600X.
In multi-threaded mode, it’s an almost perfect copy of the results under Geekbench 3, except that our 13900K takes the gold medal. Let’s note that the 13600K is a bit more behind the 12900K.
CPU-Z 17.01.64 Benchmark in Single Thread and Multi Thread:
New benchmark that we have just added since it is more and more used by the brands in order to put forward the performances of the processor. To use it, nothing could be easier, just download the latest version of CPU-Z which is currently version 2.0.2. Then go to the “Bench” tab to check the performance in single and multi thread. The version of the benchmark that we used is 17.01.64.
 In this benchmark that we have just added for the Ryzen 7000 test, our two Raptor Lakes take the first two places.
  Finally, we find a table that respects the number of cores and the most recent generations of processors. This series of tests allows us to see that Intel’s new flagship, the 13900K, does not crush everything in its path, as was the case with the arrival of the 12900K. The Ryzen 7950X holds the bar and competes without difficulty with it according to the benchmark. When the 13900KS arrives, the graphics may change a bit since it will reach 6 GHz on one or two cores. [nextpage title=”Synthetic benchmarks:”] Let’s start with a series of synthetic tests that we use regularly. We have opted for the CPU scores of the 3DMark benchmarks. The idea is to isolate only the CPU score by making a custom test.
Here are the results obtained in Fire Strike and Time Spy. In Fire Strike, whether it is for the “standard” or the “ultra” version, the physics test (CPU) is identical. Therefore, you will only find the score of Fire Strike. On the other hand, for Time Spy and Time Spy Extreme, the tests are different, so you will get both scores. These scores are very interesting for overclockers to choose the platform that will offer the best performance in order to break a maximum of records.
CPU score at Fire Strike:
Let’s start with 3DMark Fire Strike, which is one of the most widely used benchmarks today. It consists of two graphics tests, a CPU test and a fourth test that combines GPU and CPU. Don’t forget to disable the demo which doesn’t add anything to the final score and prolongs the benchmark(unnecessarily).  The CPU score under Fire Strike has always favored AMD processors but here, the 13900K puts a slap in the face of the 7950X since it obtains a score of 53707 leaving the AMD processor at 4822 points! The 13600K also improves on the 12600K thanks to the extra 4 E-core.
CPU score in Time Spy :
The second test is 3DMark Time Spy. Although this one is done in 1440p, it has the particularity of using DirectX 12. It consists of two graphical tests and a CPU test. As for Fire Strike, don’t forget to disable the demo. These two first benchmarks are proposed by UL Benchmark.  It is again the i9-13900K that dominates and in what way this CPU benchmark under Time Spy. The gap is simply enormous. The 13600K also manages to enter the top 3 with its score of 18497 points.
CPU score at Time Spy Extreme:
The second test is 3DMark Time Spy. Although this one is done in 2160p, it has the particularity of using DirectX 12. It consists of two graphical tests and a CPU test. As for Fire Strike, don’t forget to disable the demo.  On the “Extreme” version of Time Spy, the Ryzen 9 7950X narrowly loses its first place. The verdict is clear, if you’re looking for a processor to bencher the graphics card under 3DMark, your best ally will be the i9-13900K! Now let’s take a look at the DDR5 throughput. [nextpage title=”AIDA64 Benchmark: “] So, for this test which will be done with the AIDA64 software, I will compare the two platforms, AMD and Intel, since I used the same kit at the same frequency and with the same timings.
AIDA has just seen its beta version evolve to 6.32.5659. It can be downloaded directly on the site but in order to benefit from all the results, you will need a license.
AIDA 64:
It is a software capable of providing you with a lot of information about your configuration, but it has the particularity of having a memory benchmark. It will calculate the speed of reading, writing, copying as well as the latency of your memory kit. It is very often used to compare memory kits between them. It is an excellent tool if you want to compare the performance of your memory kit with those we have already had the opportunity to test. The version used for the tests is v6.75.6121 beta, the latest version at the time of starting the tests.
 We should have great similarities between the 12900K and the 13900K and between the 12600K and the 13600K. This is indeed the case for our first two processors but not at all for the 13600K which shows us “strange” performances. These abnormal performances will be repeated in the graphs below which make us think of a problem with the software. We will do these tests again in a few weeks.
 In writing, the observation is perfectly identical with the 12900K and the 13900K which obtain almost the same performances.
 The same is true for copying, even if our 13900K shows a slight difference. The scores of our 13600K are still as strange.
 We finish on an average note with a latency of 66,7 n/s which is far from being very satisfactory. We will not hesitate to come back to the performances in AIDA64 if the next BIOS solve or improve these scores for both AMD and our i5-13600K. [nextpage title=”Power consumption: “] As for the power consumption tests, on our side, we didn’t modify anything and we wanted to know how, by default, our configuration would react. Basically, we installed the CPU and loaded the XMP profile. Then we did our various readings and benchmarks. Regarding the power consumption, we used the Cinebench R23 benchmark.
We are here on multi thread. The idea is to measure the average consumption of our different processors. Be careful, this is a global consumption of the configuration. Currently, we are not yet able to measure independently and correctly the CPU consumption, but it is in progress. We still have some points to optimize in order to be fully convinced of the accuracy of our readings.
This consumption is almost the extreme version of the processor since all the cores are used at 100%. In gaming, you will have a much lower consumption of the processor since many less cores will be used.
 Explosion of the consumption but not in the good sense since on our first test we note an average of 464,9 watts during the benchmark Cinebench R23 in multi threads for the 13900K. This seems to us really huge compared to the previous generation even if E-Core has been added to this 13900K. After research it is because of the ” Asus MultiCore Enhancement ” option left in AUTO which removes all the Intel limits and thus seeks the best performance but at the expense of power consumption.


If we deactivate this option, then the consumption becomes normal, well still high but logical against the 12900K since it is then 381.2 watts. In terms of performance, on a Cinebench R23, we go from a score of 40626 to a score of 38466, a loss of 5%. The performances are thus very slightly lower but the consumption reduced.
Please note that this does not affect our results, as we have always tested other processors in the same way, but this is the first time that the power consumption explodes like this. Maybe this will be solved with a BIOS update. [nextpage title=”CPU overclocking:”] A new platform means time to adapt, but since we are quite close to the Z690 chipset, we shouldn’t have too much trouble. We will just have to take into account the new specificities of the processors in terms of frequencies.
Protocol:
Before starting, it is necessary to have one or more reference scores with our i9-13900K/i5-13600K at stock frequencies , i.e., without having made any modification except for having activated the XMP profile. It is also very important to have a sheet of paper at hand that will allow you to note down all the tests you are going to perform as well as the results or failures. Personally, I have hundreds of sheets of my tests on which I sometimes go back to know how the processor behaved on such motherboard or in such test conditions. My own little bible.
For H24 overclocking, you will of course have to take more time to fine-tune the voltage in order to provide it with the minimum necessary but also to adjust each core independently if you want to take advantage of the maximum performance.
Load-Line Calibration in BIOS:
 In the case of Rocket Lake, even if Asus advises a Level 4 for overclocking, I opted for a Level 7 in order to have the least vdroop possible. Basically, I want the voltage chosen to be as close as possible to the load voltage. In the tables below, you can see the selected voltage, the effective voltage in idle and finally in load . The readings are made with a multimeter at the PCB of the motherboard. It is very important to know the real voltage brought to the different components but especially to your processor.
Overclocking under watercooling in different stages:
As usual, I will start the tests by choosing, via the BIOS, a starting frequency applied on the 8 P-Cores of the i9-13900K. I chose a starting frequency of 5500 MHz with a multiplier of 55, a BCLK of 100, a voltage of 1.20 volt and a Level 7. All the other options are in AUTO. For the i5-13600K, we will start from 5100 MHz (51 x 100). The idea is then, in the OS, to test the stability on several runs of Cinebench R23 multithreaded . If it’s stable, I increase the frequency by 100 MHz while rechecking the stability. If the benchmark crashes, I increase the voltage by 0.05 volt steps in order to find a stability allowing to run the benchmark. The objective is to get a “quick” idea of the maximum benchmarkable frequency.
Here is what we obtained for the i9-13900K. As you can see, we were very quickly limited by the temperature and this despite a rather low voltage.
 Our best score is 41796 at Cinebench R23 but with temperatures between 90 and 100°C. We will see how it behaves under LN2. The i5-13600K had some good surprises for us!

We were able to reach a frequency of 5.6 GHz on the P-Core, 4.6 GHz on the E-Core and raise the uncore frequency to 5.0 GHz. The temperatures are rather well contained, which allows us to pass the R23 single score to 27477 points (24274 at stock) and the multi score to 2214 points (2013 at stock).


The excellent performance in benchmarks combined with its excellent overclocking potential should make it one of the most popular Raptor Lake processors. [nextpage title=”Memory overclocking:”] There is a lot of change at this level since the Hynix A-die kits are starting to arrive. We have just received a copy of the Teamgroup Delta RGB 7200 MT/s CL34. And the least we can say is that it performs very very well. I haven’t been able to talk about it yet because of the NDA but I installed the i9-13900K on the ROG Maximus Z690 APEX to see how far I could push this 7200 MT/s CL34 kit. Well, it’s quite amazing since after a few hours of testing, we managed to run AIDA64 and Geekbench 3.4.4 at 8200 MT/s in 34-46-46-84 for 1.55 volt, and all this in air cooling!


Needless to say, it’s really very enjoyable and it revives the interest in memory overclocking. We should see more and more DDR5 memory kits with XMP above 7000 MT/s. We will come back to the memory overclocking of the ROG Maximus Z790 Extreme in its dedicated test. We wanted to test on the Z690 APEX first since we had many points of comparison. [nextpage title=”The last word:”] Without being a revolution, Raptor Lake does well and manages to take the lead over the Ryzen 7000 but not in a crushing way as was the case with Alder Lake. The Ryzen 9 7950X holds its own against the i9-13900K in some tasks that require the use of all the cores of each processor. However, if you want to get into 3DMark benchmarking, then the i9-13900K is definitely the one to buy.
Intel has finally made the most of this hybrid architecture (P-Core and E-Core) and to say the least, it has proven to be very effective. Now, as with AMD, the top of the range consumes a lot of power and we will have to take this into account in this period. We take this opportunity to tell you that the next few days will be dedicated to the Ryzen 7600X vs Intel i5-13600K gaming match. We also propose a report dedicated to the optimization of the i9-13900K in order to reduce its power consumption and its temperature but also for the Ryzen 9 7950X.
Advantage for Intel in terms of price ?
Finally, the price of the i9-13900K and i5-13600K seems more aggressive than the Ryzen 9 7950X($799) and Ryzen 5 7600X($299). Another significant advantage is that these two processors will be compatible with motherboards of the previous generation that also have a LGA-1700 socket. So you won’t have to invest in a new motherboard or DDR5 if you already have one. Pre-sales of Raptor Lake suggest a price of $799 for the i9-13900K and $379 for the i5-13600K. Of course, the 13600K is more expensive than the 7600X but its performance is much better and even exceeds that of the Ryzen 7 7700X priced at $399. The i5-13600K is therefore a very interesting processor that should have a natural success.
 As you read this article, we are busy testing these two Raptor Lakes under liquid nitrogen! We will of course keep you informed in an article of the performances we obtained!