


Intel configuration test:
Of course, this kit will only be tested on an Intel platform, as we’re here in a particular configuration with the WS W790E-SAGE SE motherboard. As a reminder, this Kingston kit is only compatible with this motherboard, the only one we have here in the lab.
- Motherboard: Asus Pro WS W790E-SAGE SE
- Processor: Intel Xeon W9-3495x
- Memory: 64 GB Kingston Fury Renegade 5600 MT/s CL36
- Graphics card: MSI GT710
- Cooling system: waterblock EK-Pro CPU WB 4677 Ni Acetal 480 mm EK radiator
- SSD: Western Digital SN850 NVMe SSD M.2
- Power supply: be quiet! Dark Power PRO 12 1500w
- Operating system: Windows 11 64-bit
Aida 64 :
 This is a software program capable of providing you with a wealth of information about your configuration, but above all it features a memory benchmark. This calculates the read, write and copy speeds, as well as the latency, of your memory kit. It is often used to compare memory kits. It’s an excellent tool if you want to compare the performance of your memory kit with those we’ve already tested.
The version used for our tests is 6.50.2812 beta, and we’ve used the performance of previously tested kits.

After this benchmark, we have 4 values: read, write, copy and latency. The results are within the norm for a 64 GB kit, but as we can see, latency is quite high. Remember that it’s more interesting to have the lowest value. Now, this value is linked to the amount of memory. For example, with our 128 GB GSKill kit, we obtained a latency of 100.6 n/s. Of course, frequency and timings also play a role.
Geekbench 3.4.4:
 This benchmark is available in several revisions, version 5 having just been released a few weeks ago. It provides two scores: one single and one multi. Using this benchmark, we’re going to focus on the performance obtained on the ” Memory Multi-Core ” score, which differentiates memory performance.
The version used for testing is 3.4.4.

Here, we’ll be looking at both single-score and multi-core. The score of 6670 points is obtained with a single active core out of the 56 available in our Xeon W9-3495X. The 205876 points are obtained with all 56 cores active. By way of comparison, we obtain a score of 113394 points with our i9-13900KS and its 8 P-Cores 16 E-Cores.
As soon as we isolate the memory score, real differences are visible between the kits. Our kit of the day scores 7657 points! This score will be better the higher the frequency and the tighter the timings.
Geekbench 5.2.5:
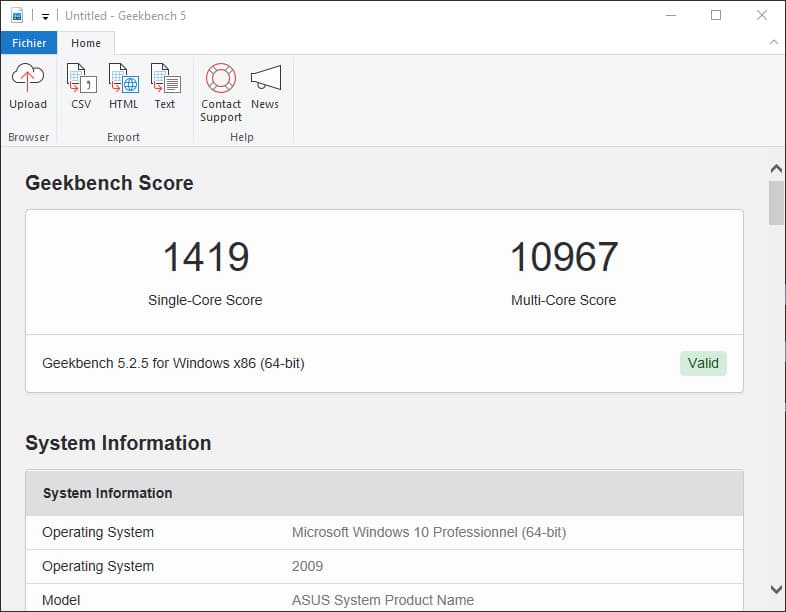 We decided to add this extra benchmark, but why? The CPU benchmark uses new tests that more closely simulate the tasks facing processors in the face of recent applications. Geekbench 5 also increases the memory used in the benchmark to better reflect the impact of this parameter on CPU results. For the time being, we’ll be keeping both, since version 3 is still widely used.

The last benchmark we use for our memory tests. Here we obtain a score of 1664 points in single-core and 38641 in multi-core. For comparison, with our i9-13900KS, we obtain a score of 26398 in multi-core.

