


Cinebench, Geekbench and CPUZ benchmarks:
Let’s start with a staple of processor benchmarks, the Cinebench series. We chose Cinebench R15, the R20 version, which is also more and more used and finally Cinebench R23, the latest one. The scores will be given in Single core and Multi core. This means that the benchmark tests the performance on one of the processor’s cores and then on all the available cores.
To do this, we will use Benchmate which has just been updated to version 10.12.2 and can be downloaded here. The advantage of Benchmate is that it already contains a whole series of benchmarks and moreover, it is recognized and certified when you want to encode your results on the Hwbot site.
As a reminder, before you start reading these results, make sure you take a look at the previous page to understand the operating frequencies of these non-X Ryzen.
Cinebench R15 Single Core and Multi Core:
A benchmark very much used especially by overclockers in order to be able to compare the performance of processors between them. It also allows you to judge the optimizations of your OS as well as your memory kit by setting a frequency and trying to score a maximum of points. Even if it is less used today with the arrival of R20 and R23, it remains a reference to compare CPUs between them since it is one of the first benchmarks used by the community.

We were expecting an improvement in single thread performance with the Ryzen 7000 and we have to admit that this is indeed the case. The Ryzen’s are in first place with a third place for our 7950X3D.

In multi-thread, the observation is slightly different and it is logical. It is mainly the total number of cores that will determine the score as well as their frequency. Our Ryzen 9 7950X3D is behind and this is quite logical because of its lower boost frequencies than the 7950X.
Cinebench R20 Single Core and Multi Core:
Cinebench R20 offers similar testing to the R15 version with SingleThread and MultiThread. Freshly landed in March 2019, it offers a more complex benchmark than the R15 version which had become a bit too easy for CPUs with many cores. Cinebench R20 requires eight times more computing power than the R15 version, and four times more memory. It can already be more like a stress benchmark since it forces your CPU to be stable for the duration of the bench.

The same is true for Cinebench R20, where our 7950X3D is just behind the 7950X. Note that the arrival of the new Raptor Lake processors has changed the top three.

In multi, it is the number of cores that speaks once again. We are on a graph that looks like the one of Cinebench R15. Note that it is the Raptor Lake i9-13900KS that now dominates this graph. We will publish its test in the coming days.
Cinebench R23 Single Core and Multi Core:
How does this new version differ from the previous ones? First of all, it is more realistic when it comes to the score obtained depending on the processor used. As a reminder, Cinebench only test the capabilities of your processor in single thread or multi thread. But the main difference is to propose a benchmark which by default will last 10 minutes! The idea for MAXON with Cinebench R23 is to propose a benchmark which will allow a certain stability in term of temperature and Boost frequencies. We will test here the fast version.

First small surprise since our sample of the day is confronted with the Ryzen 9 7900X with an almost identical score.
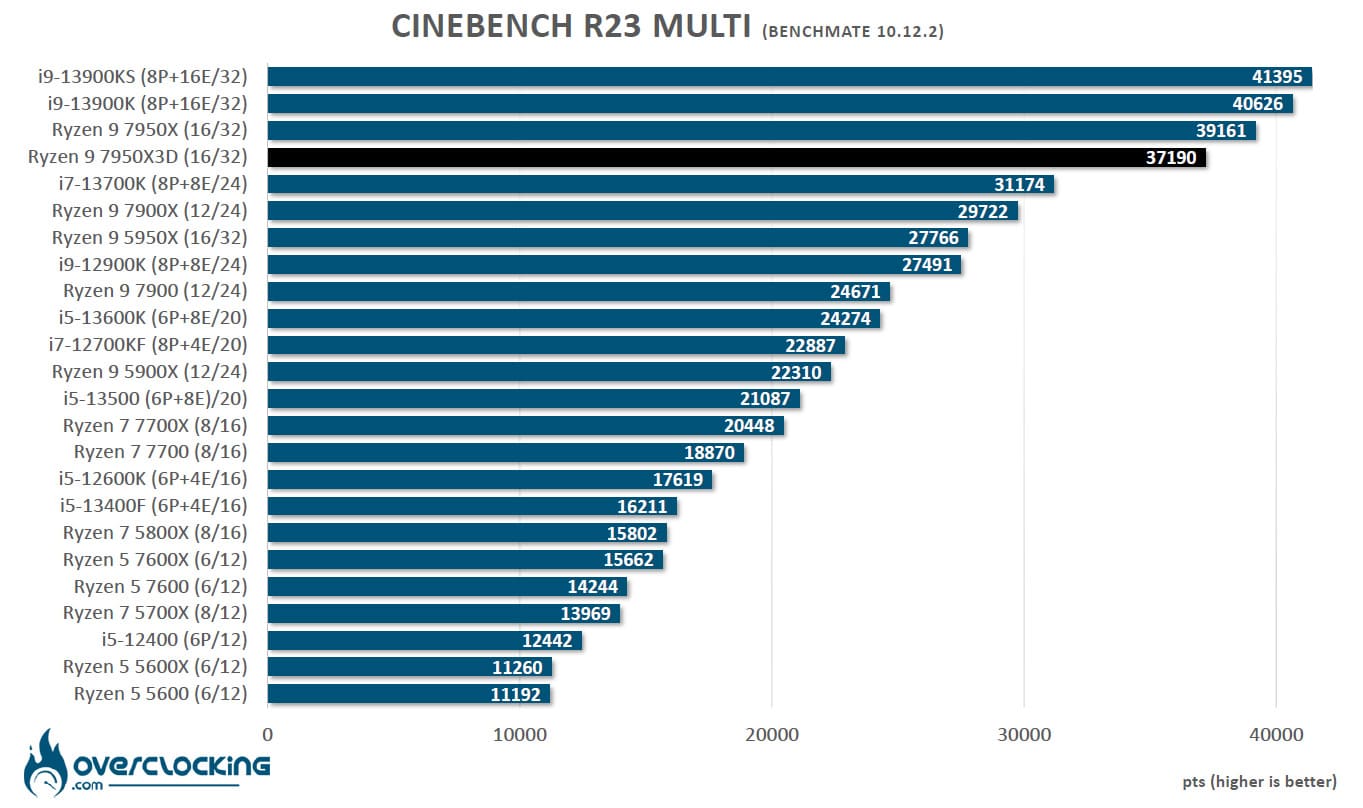
In multi, we do not change the profile of the graph with scores once again convincing and reflecting the number and frequency of operation of the cores for our Ryzen 7000X.
Geekbench 3.4.4 Single Core and Multi Core:
This is a benchmark available in several revisions, version 5 is more and more used in recent months and is also often used for CPU performance leaks. It allows to obtain two scores: one in single core and the other in multi core. The version used for the tests is 3.4.4 and 5.2.5. Please note that in order to take full advantage of these two benchmarks, a license is required and we perform the bench in 64-bit.

The score obtained under Geekbench 3 in singlecore is very surprising since it comes just behind the Ryzen 5 7600X. It is quite surprising and can be translated by a less good support of this old benchmark on the 7000X3D processors. We’ll see what happens on Geekbench 5.
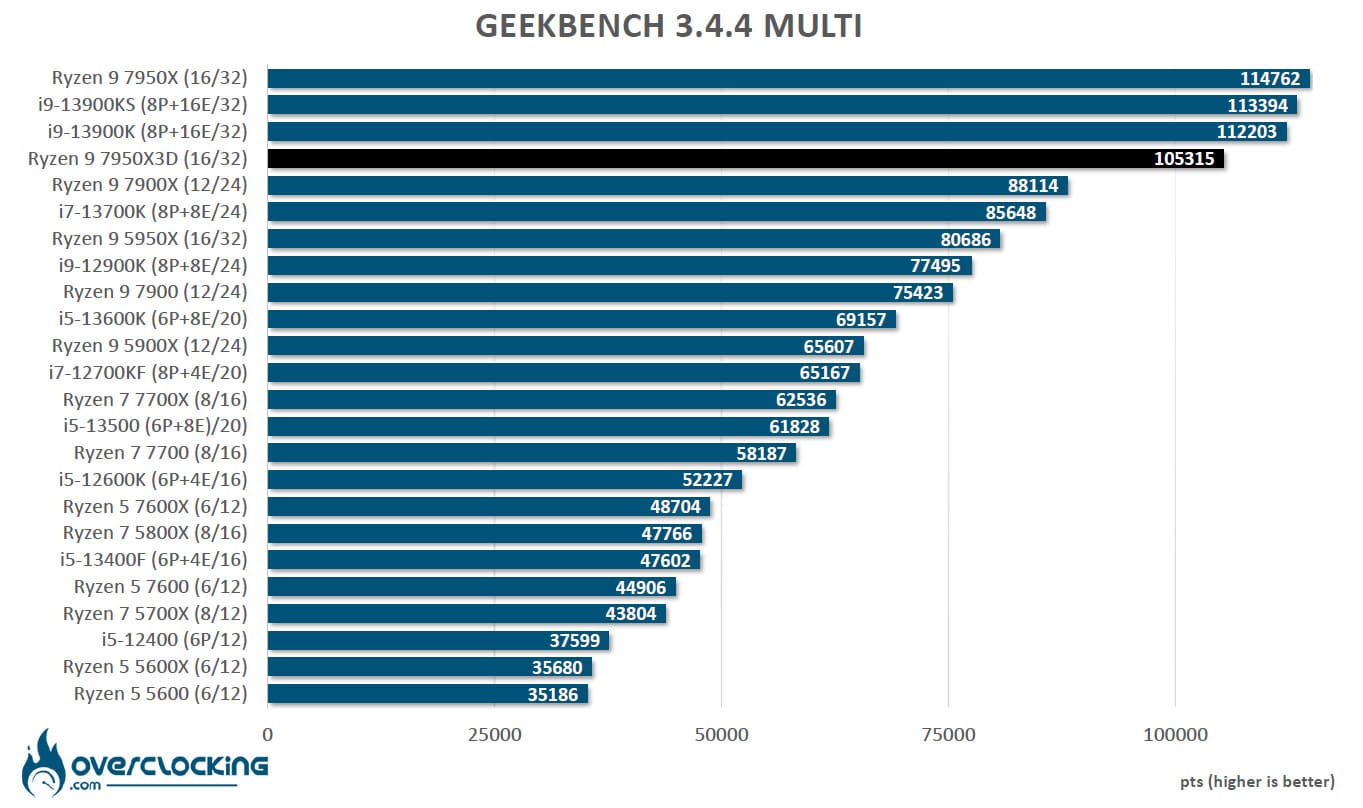
In multicore, the graphics become consistent again even though the Ryzen 9 7950X3D performs nearly 9% worse than the Ryzen 9 7950X.
GeekBench 5.2.5 Single Core and Multi Core:
The latest version of the GeekBench software, it is becoming more and more widespread and used by journalists. It allows, like the version above, to do memory and processor performance tests. We decided to add this additional benchmark but why? The CPU benchmark uses new tests that more closely simulate the tasks that processors face with recent applications. Geekbench 5 also increases the memory used in the benchmark to better reflect the impact of this parameter on the CPU results.
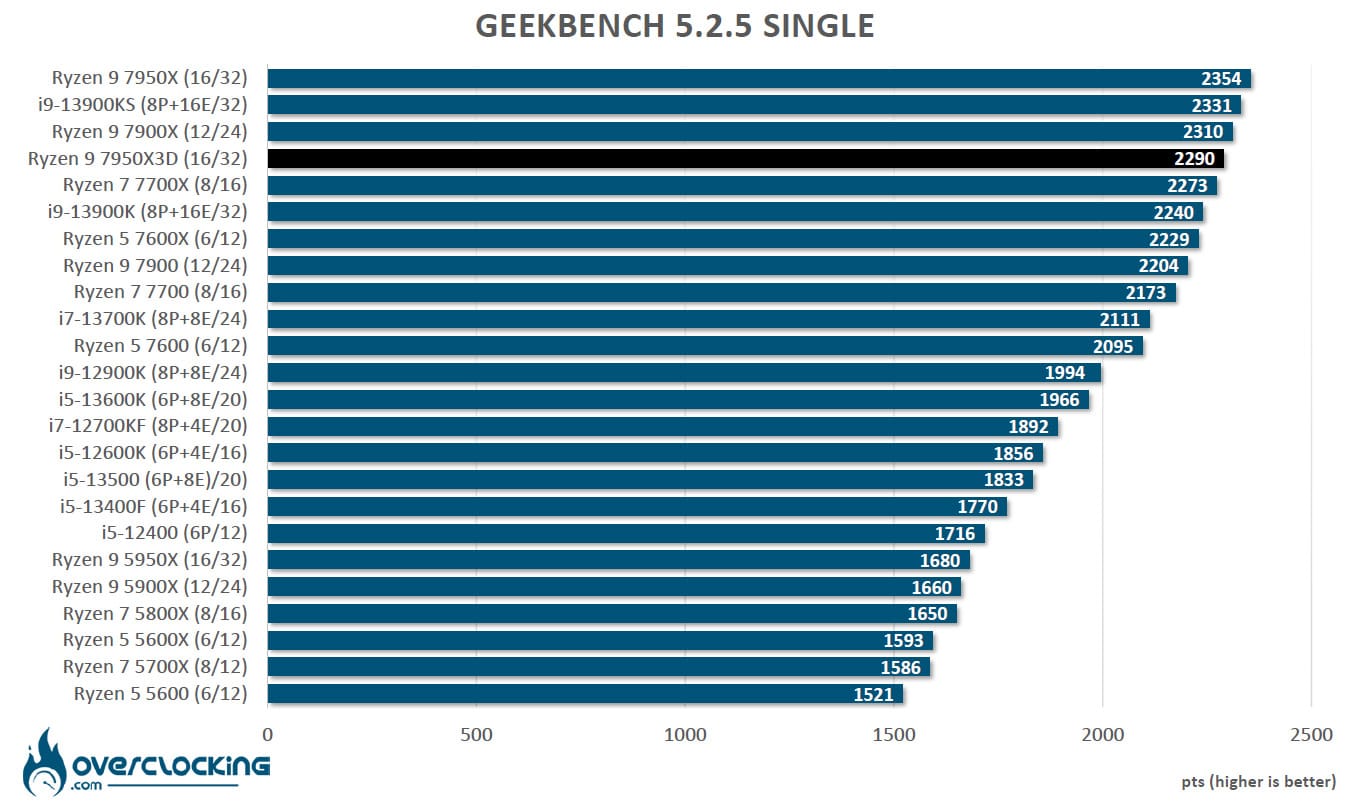
Performance is more consistent than on Geekbench 3 even though our 7950X3D is still behind the 7900X. We already had the thought that this was not the latest version of Geekbench 5 and it is correct. But this one was not available at the time of updating our graphics, so we are still on this version 5.2.5. Geekbench 6 has just been released and we may integrate it in our tests soon.

In multi-threaded mode, our sample of the day takes up a place that corresponds to its potential, which is still limited by its frequency compared to the 7950X.
CPU-Z 17.01.64 benchmark in Single Thread and Multi Thread :
New benchmark that we have just added since it is increasingly used by brands in order to put forward the performance of the processor. To use it, nothing could be easier, just download the latest version of CPU-Z which is currently version 2.0.2. Then go to the “Bench” tab to check the performance in single and multi thread. The version of the benchmark that we used is 17.01.64.

Same observation as in Geekbench3, the single score is catastrophic and even incomprehensible. We are convinced that this is a bug with our 7950X3D.

Finally, we find a table that respects a little more the number of cores and the most recent generations of processors. This first series of tests allows us to highlight that our Ryzen 9 7950X3D is a bit behind the 7950X in multithreaded tasks because of lower frequencies!
: GDDR6 on all models?")