




3DMark series benchmarks:
Our first series of tests is dedicated to synthetic benchmarks. These are often used for overclocking competitions , but are also very interesting for comparing different GPUs. We’ll be focusing on benchmarks from the 3DMark series. For this new version of our graphics, and for the 3DMark test section, we’ve also isolated the GPU score. You’ll therefore find, where stipulated in the benchmark, both the overall score and the GPU score.
3DMark Fire Strike and Fire Strike Ultra:
Let’s start with 3DMark Fire Strike, one of today’s most widely used benchmarks. It consists of two graphics tests, a CPU test and a fourth test that combines GPU and CPU. Don’t forget to deactivate the demo, which makes no contribution to the final score and prolongs the benchmark ‘s duration (unnecessarily). The version used for these tests is, of course, the latest available.
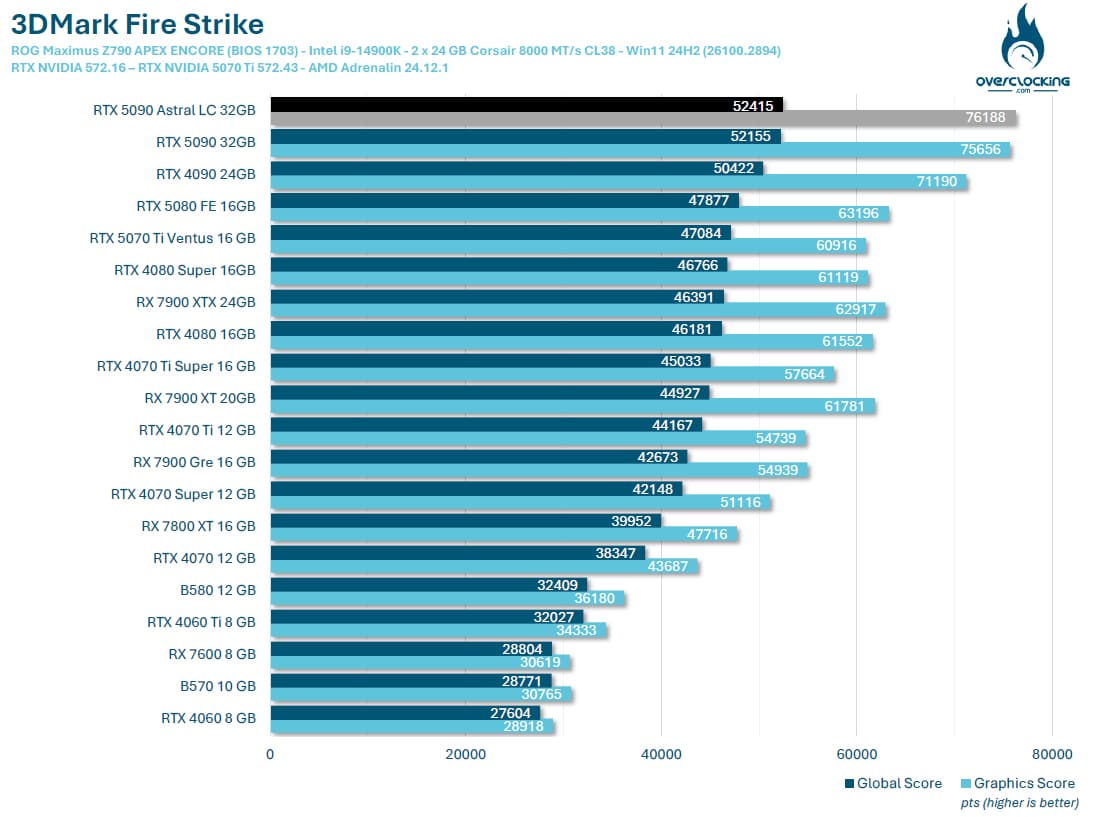
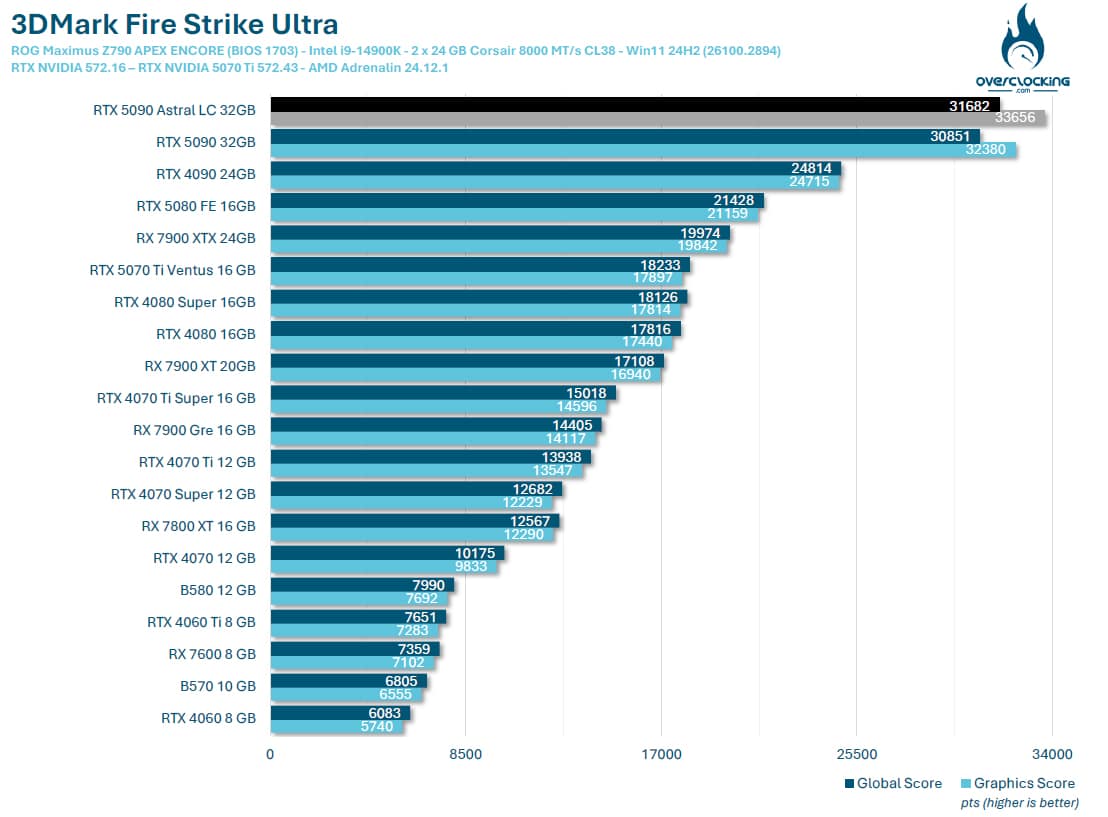
We start our tests with the two Fire Strike and Fire Strike Ultra benchmarks, and to say the least, they’re off to a great start. While under Fire Strike our RTX 5090 takes first place, with a 6.2% gain in graphics score, it crushes the competition on the Ultra version with a 31% gain.
3DMark Time Spy and Time Spy Extreme :
The second test is 3DMark Time Spy. Although this one is performed in 1440p, its main feature is that it uses DirectX 12. It consists of two graphics tests and a CPU test. As with Fire Strike, don’t forget to disable the demo. These first two benchmarks are provided by UL Benchmark.
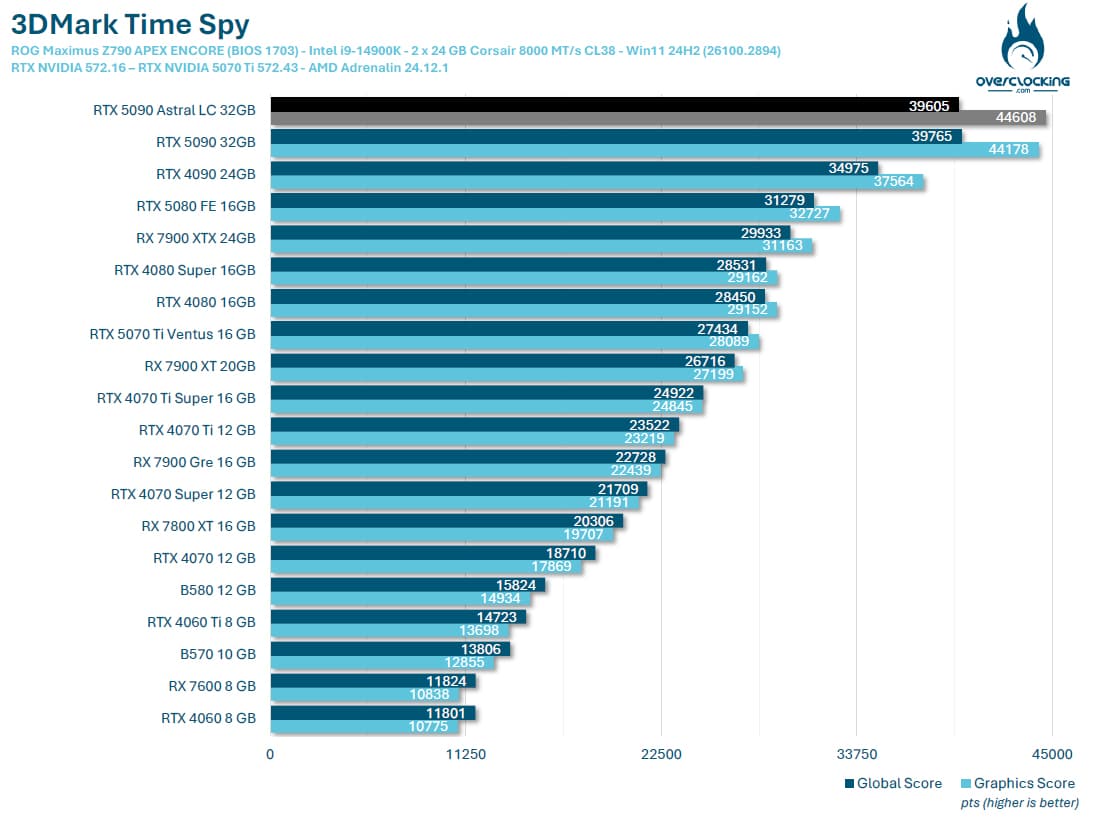
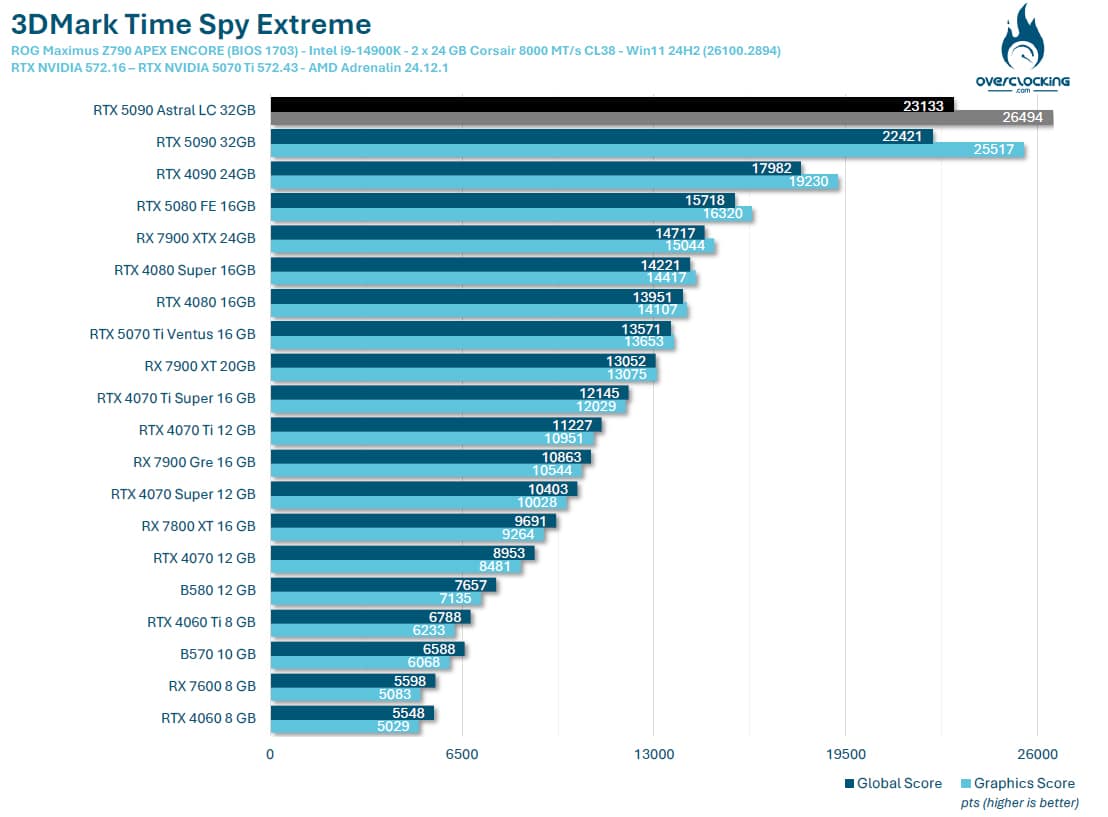
We continue with Time Spy, where results are still very high. We start with a 17.6% increase in Time Spy’s graphical score and a 32.7% increase in the Extreme version. The scores on Hwbot are about to change.
3DMark Speed Way:
Ulbenchmark’s latest benchmark, and it’s nice to be able to say we’re going to benchmark this Speed Way. It uses DirectX 12 and defaults to 1440p. We haven’t modified anything, so we’re using the original benchmark.
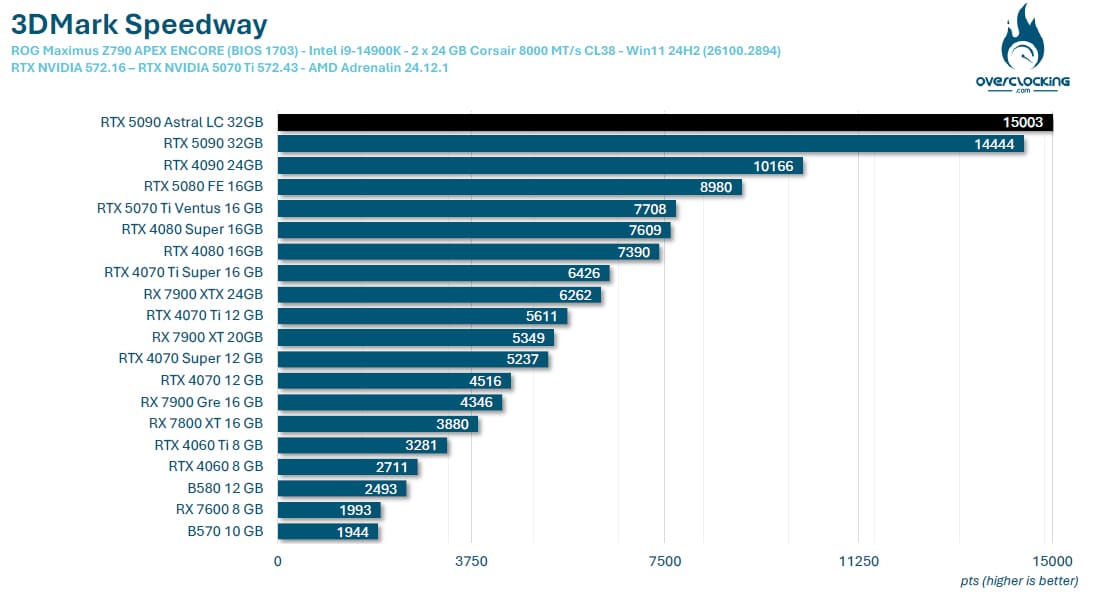
In Speed Way, our sample of the day takes first place once again and very easily, with a score of 15003 points, leaving the RTX 4090 at 4837 points.
3DMark Port Royal :
Here’s a benchmark we left out last year, but which you may have wanted to see again in our tests. It’s still widely used, especially in the overclocking community. So we’ve decided to add it to our tests.
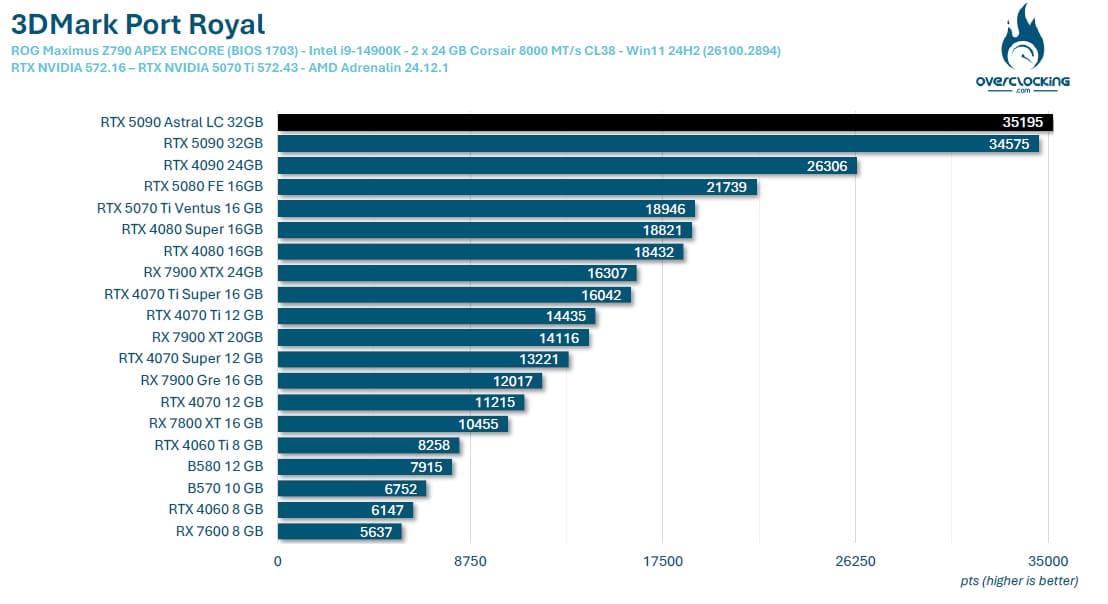
The findings remain the same, and even if the RTX 4090 was already performing extremely well, the new RTX 5090 comes in for a big slap in the face.
3DMark Steel Nomad:
The latest benchmark in the 3DMark suite, Steel Nomad will replace Time Spy as the most recent benchmark in the 3DMark suite. The good news, however, is that it will be free for users who already have a key. The program includes a test bench based on Microsoft’s DirectX12 API. However, there will be no ray tracing, but the scene will use an “extreme” level of geometry and rasterized light.
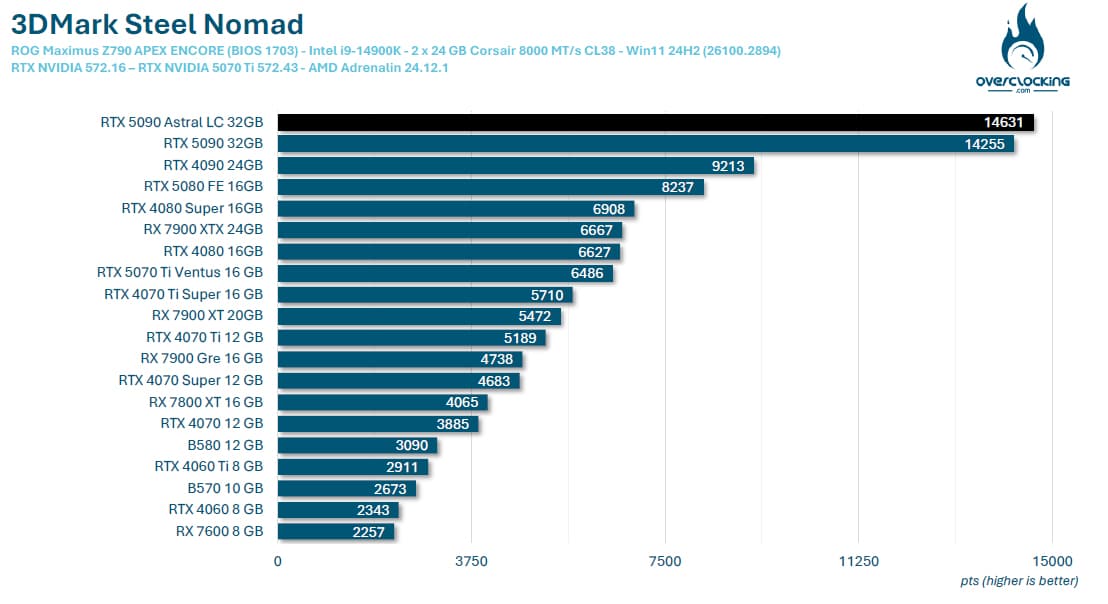
Finally, the penultimate benchmark in the 3DMark series, Steel Nomad, which has just been released, keeps our ROG Astral LC RTX 5090 ahead of the pack, with a 58.8% gain over the RTX 4090.
3DMark NVIDIA DLSS:
We’ve added this benchmark here, highlighting the potential of DLSS, which will now be compatible with DLSS 4, and giving us the opportunity to test it with this ROG Astral LC RTX 5090.
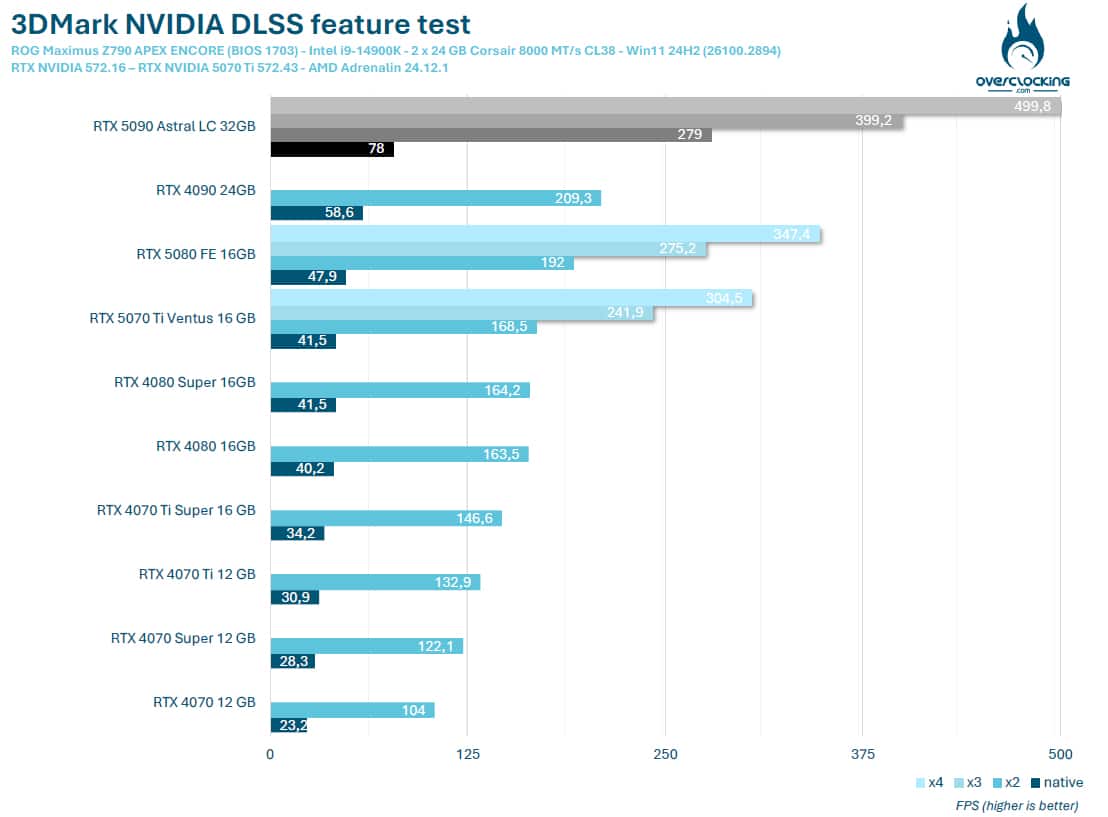
Finally, the last benchmark in the 3DMark series, the NVIDIA DLSS feature test will enable us to highlight, for the first time, the contribution of DLSS 4 technology. As a reminder, Frame Generation, on RTX 5000s, can be selected as x2 (one frame), x3 (two frames) or x4 (three frames). This refers to the number of additional frames that can be added between two native frames.