
[nextpage title=”Introduction:”] Today, AMD officially launches its new GPU, the RX 9060 XT, which will be available in 8 or 16 GB versions. To mark the occasion, we received a copy of the XFX Swift RX 9060 XT 16 GB graphics card. With the release of the RTX 5060 Ti a few weeks ago, we’ll be assessing the Reds’ response to NVIDIA. And while the NDA only ends today, we already know the MSRP prices, as they were announced at Computex 2025, and these are clearly to the advantage of the reds. The RX 9060 XT 8 GB version will start at $299, and the 16 GB at $349. Remember that the RTX 5060 Ti start at $379 for the 8 GB version and $429 for the 16 GB. So we have a price difference of $80 between the two 16 GB models, but more importantly, the AMD 16 GB model is $30 cheaper than the 8 GB Green ones. Will we see a price drop from NVIDIA in a few days’ time, after the tests are out?
Thanks to AMD for making a copy of the XFX Swift RX 9060 XT 16 GB available for this article [nextpage title=”XFX Swift RX 9060 XT:”]
Architecture:
The AMD Radeon RX 9000 series graphics cards are built on the new AMD RDNA 4 architecture with new ray tracing and AI gas pedals as well as support for AMD FidelityFX Super Resolution 4, more traditionally called, AMD FSR 4. This should offer improvements in image quality over AMD FSR 3.1 upscaling. Although not yet fully deployed when the first RX 9000s were launched, this is now the case, even if the number of games is still limited. Let’s see what AMD’s slides unveiled at Computex 2025 tell us.


At the launch of the RX 9070 and RX 9070 XT, AMD claimed that more and more gamers were turning to 1440p definition instead of 1080p. Here, the claim is slightly different, as we’re now talking about 80% of gamers playing in either 1080p or 1440p. Well, on that score, we’re pretty convinced by the data


The following slides show us the RX 9060 XT’s specifications, as well as a comparison between the 16 GB version of the RX 9060 XT and the 8 GB RTX 5060 Ti. Consumption is identical, but NVIDIA charges more, and the green model is 8 GB smaller


AMD highlights the benefits of 16 GB for 1440p definition. This is a real subject, which we’ll come back to in our article. In 2025, and if you want to keep your graphics card for a few years, we think 16 GB is a better choice than 8 GB.


Then it’s the turn of FSR 4, with over 60 compatible games to be released on June 5 this year. It will therefore be interesting to be able to compare games with FSR4 and DLSS4 technology in the near future


Finally, MSRP prices of $299 for the RX 9060 XT 8 GB and $349 for the 16 GB model. As far as European prices are concerned, AMD has just announced a price of €319.90 for the 8 GB and €369.90 for the 16 GB.
The XFX Swift RX 9060 XT bundle:
We’re talking about an entry-level graphics card here, with an MSRP of $349 on paper. Let’s hope there are no nasty surprises at launch. The bundle boils down to the bare minimum, since there’s nothing in it


The box uses a dress code we’re not used to seeing, since it’s been a long time since we’ve had an XFX model in the editorial office. As a reminder, the XFX range consists mainly of three series: Swift, QuickSilver and Mercury, which represent XFX’s top-of-the-range models.
The cooling system:
This is a ” custom ” board, i.e., with a PCB and cooling system specific to AMD’s partner brand, i.e., XFX. There are no reference boards in the RX 9000 range, only partner boards, something we personally regret


The XFX Swift RX 9060 XT features a cooling system consisting of two 95 mm fans with 11 blades. The design of this Swift model is very sober, with no RGB backlighting. The black plastic casing will match any motherboard and any case.


At the rear, an imposing steel backplate stiffens the board. The PCB is much shorter than the heatsink, and stops at the power connector. As you can see, hot air escapes through the top edge of the board, via the bracket, but also through the backplate, which is cut out at the end. We’ll be able to judge the temperature and performance of the cooling system during our tests. In terms of thickness, our sample occupies 2.5 slots.
Connections:
To power this model, XFX has chosen to use a single 8-pin power connector


As far as video is concerned, you’ll have two DisplayPort 2.1b and one HDMI 2.1b. [nextpage title=”Technical specifications:”] A quick run through GPU-Z to check that the information read is correct. As you can see, this is indeed the case, since a new version of GPU-Z has just been put online, a few days before the official launch of the RX 9060 XT. In terms of frequency, GPU-Z has announced a base frequency of 2787 MHz and a boost frequency of 3324 MHz for the XFX Swift RX 9060 XT 16 GB. The card features 16 GB of GDDR6 memory (322 GB/s) on a 128-bit bus at 2518 MHz. This model probably has the base frequencies, but some custom boards may offer factory overclocking depending on their cooling system. Bear in mind that the GPU frequency may be higher in benchmarks, depending on the quality of your chip and the cooling system used.
In fact, we ran a test under 3DMark Time Spy to observe the GPU boost frequency. At certain points, the GPU reaches the maximum frequency of 3232 MHz, rather than the expected 3324 MHz. Memory frequency remains unchanged, which is perfectly normal. GPU-Z reports a power consumption of 183 watts, which means we shouldn’t have much overclocking margin on this model, bearing in mind that the power limit only offers a 10% margin, as shown in the screenshot above.
As far as temperatures are concerned, the core sit at 52°C and the memory at 76°C. At the time of this first test, it was 22°C in the lab. We’ll be checking temperatures in our more in-depth tests, especially those of the memory and Hot Spot. The fans are far from running at maximum speed, and the card is a little noisy. As a reminder, we’re on a bench, not inside a case. Let’s get on with the first tests!
[nextpage title=”The test configuration: “]
As we said in the introduction, we’ve updated all our graphics using the latest drivers from NVIDIA, AMD and, of course, INTEL. We also took the opportunity to slightly modify our test configuration and add new games to our protocol. So here we go again, with a new series of tests and graphics on this slightly modified configuration:
- Motherboard: ROG Maximus Z790 APEX Encore
- Processor : Intel Alder Lake i9-14900K delid
- Cooling system: EK-Nucleus AIO CR360 Direct Die D-RGB – 1700
- Memory: 48 GB Corsair Dominator Titanium 8000 MT/s CL38
- Graphics card: XFX Swift RX 9060 XT, PALIT RTX 5060 Ti Infinity 3 16 GB, NVIDIA RTX 5070 FE, MSI RTX 5070 Ti Ventus 3X OC, NVIDIA RTX 4070 Ti Super FE, NVIDIA RTX 4070 Ti FE, NVIDIA RTX 4070 Super FE, NVIDIA RTX 4070 FE, AMD RX 7900 GRE and AMD RX 7800 XT
- SSD: Western Digital Black SN750 2 TB + EKWB heat sink
- Power supply: Corsair AX1600i
- Operating system: Windows 11 64-bit 24H2 (26100.2894)
For this test, we used a fairly high-end configuration based on an i9-14900K delid processor and DDR5 memory. For our tests, we’re using either an MSI Oculux NXG253R or a ROG Strix XG27UCS on loan from ASUS France, depending on the definition tested.
Our test protocol :
All boards are tested at stock frequencies and without any optimization. For the various benchmarks, whether synthetic or gaming, we’ll opt for 1080p, 1440p and 2160p resolutions, depending on the card’s performance


Here, with this XFX Swift RX 9060 XT 16 GB model, there’s no doubt about the definition: it’ll be 1080p and 1440p in rasterization. We’ll be using FSR in Performance mode, with Frame Generation or Multi Frame Generation, as well as ray tracing where available. As you can see, we’re now running Windows 11, and we’ve activated the ” ReSize BAR ” in the BIOS, visible in GPU-Z. Now that you know everything about our test configuration, it’s time to get started!
[nextpage title=”3DMark series benchmarks: “]
Our first series of tests will be dedicated to synthetic benchmarks. These are often used for overclocking competitions , but are also very interesting for comparing different GPUs. We’ll be focusing on benchmarks from the 3DMark series. For this new version of our graphics, and for the 3DMark test section, we’ve also isolated the GPU score. So you’ll find, where stipulated in the benchmark, both the overall score and the GPU score.
3DMark Fire Strike and Fire Strike Ultra:
Let’s start with 3DMark Fire Strike, one of the most widely used benchmarks today. It consists of two graphics tests, a CPU test and a fourth test that combines GPU and CPU. Don’t forget to deactivate the demo, which makes no contribution to the final score and prolongs the benchmark ‘s duration (unnecessarily). The version used for these tests is, of course, the latest available.
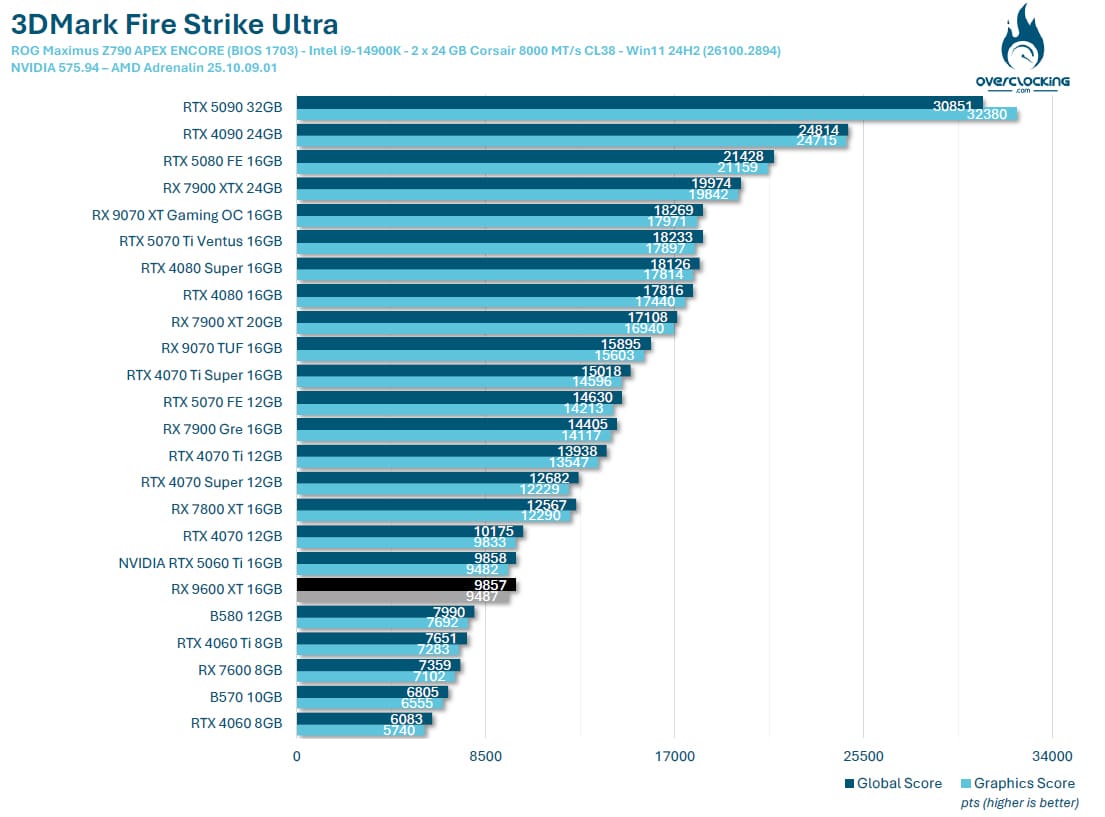
We begin our tests with the two Fire Strike and Fire Strike Ultra benchmarks. What we’re unfortunately going to miss in today’s graphics is the presence of the 8 GB models, whether from AMD or NVIDIA. The least we can say is that it starts rather timidly, with an XFX Swift RX 9060 XT that does almost as well as the RTX 5060 Ti, but under Fire Strike Ultra.
3DMark Time Spy and Time Spy Extreme:
The second test is 3DMark Time Spy. Although this one is performed in 1440p, its main feature is that it uses DirectX 12. It consists of two graphics tests and a CPU test. As with Fire Strike, don’t forget to disable the demo. These first two benchmarks are provided by UL Benchmark.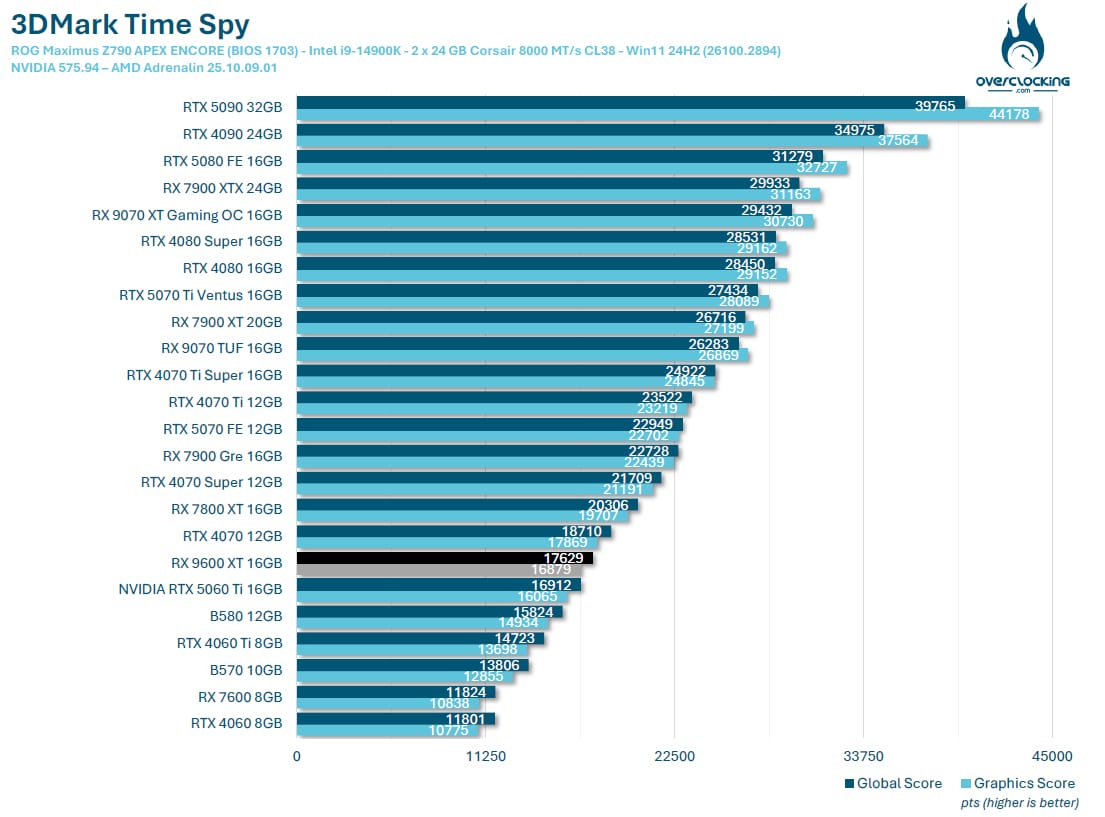
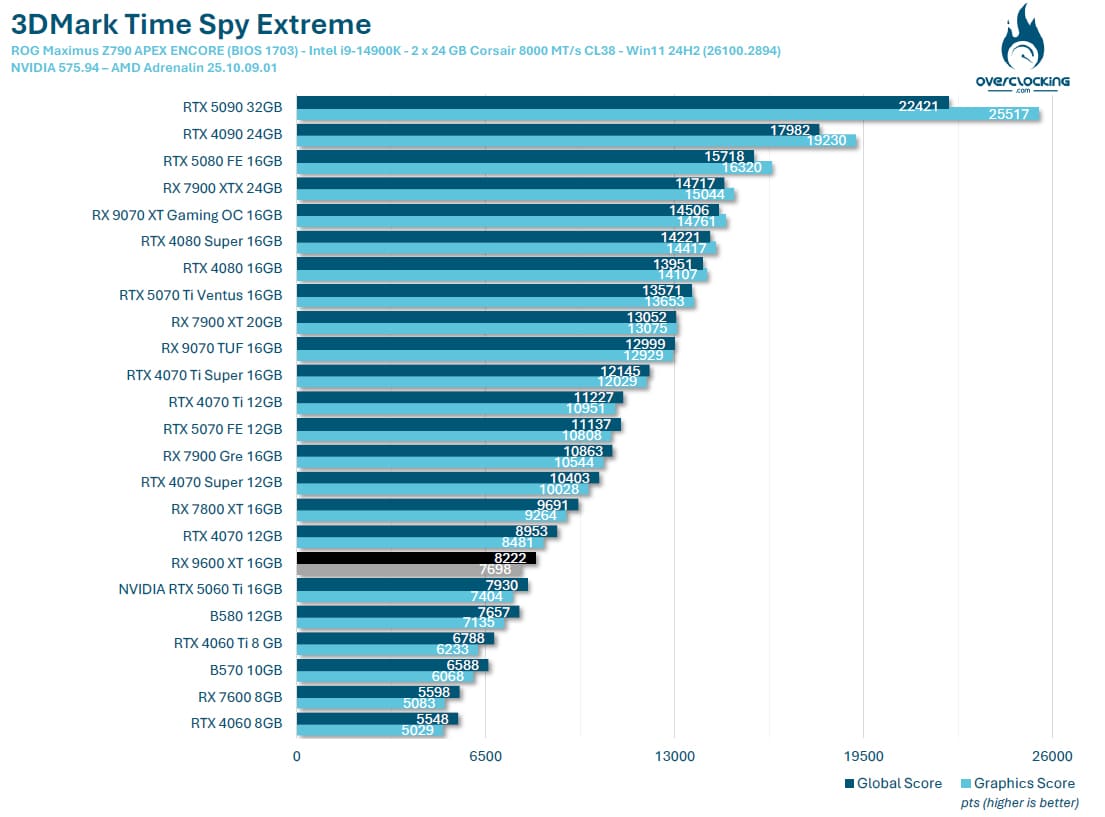
We continue with Time Spy, where the results are, this time, to the advantage of our XFX Swift RX 9060 XT. Time Spy gives an initial idea of in-game performance, and we should therefore have the RX 9060 XT performing perhaps slightly better than the RTX 5060 Ti, but it’s still too early to tell.
3DMark Speed Way:
Ulbenchmark’s latest benchmark, and it’s nice to be able to say that we’re going to have a go at this Speed Way. It uses DirectX 12 and defaults to 1440p. We haven’t modified anything, so we’re using the original benchmark.
In Speed Way, our XFX Swift RX 9060 XT 16 GB scores 3016 points, a slap in the face compare to the RTX 5060 Ti’s 4144 points.
3DMark Port Royal:
Here’s a benchmark we left out last year, but which you may have wanted to see again in our tests. It’s still widely used, especially in the overclocking community. So we’ve decided to add it to our tests.
In Port Royal, things even out, with only a 3.7% difference between reds and greens, but still in favor of the NVIDIA model.
3DMark Steel Nomad:
The latest benchmark in the 3DMark suite, Steel Nomad replaces Time Spy as the most recent benchmark in the 3DMark suite. The good news, however, is that it will be free for users who already have a key. The program includes a test bench based on Microsoft’s DirectX 12 API. However, there will be no ray tracing, but the scene will use an “extreme” level of geometry and rasterized light.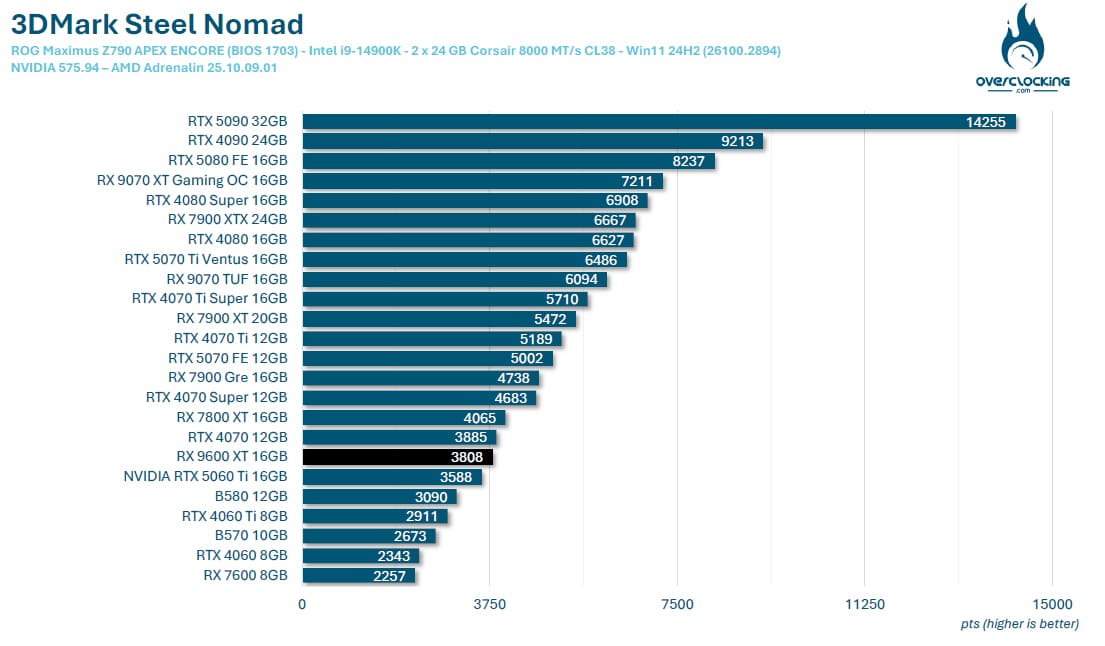
Finally, the last benchmark in the 3DMark series, Steel Nomad, which has just arrived, offers our XFX Swift RX 9060 XT 16 GB, the chance to take the lead over the RTX 5060 Ti, with a score of 3808 points.
nextpage title=”UL Procyon AI Image / Text Generation :”]
UL Procyon AI Image Generation:
UL Benchmark not only offers its 3DMark benchmark suite, but also UL Procyon, to meet the demand for Artificial Intelligence evaluation. This benchmark was chosen for its ease of implementation. The benchmark will generate 4 x 4 images and provide us with a score as well as a result in the form of the time, in seconds, required to generate an image. The software supports several AI inference engines depending on the GPU used, so we’ll be using the benchmark in Stable Diffusion 1.5 (FP16) mode. It is intended for mid-range GPUs. The test will create 16 images with a resolution of 512 x 512, in batches of 4. There’s another test called Stable Diffusion XL (FP16), where 16 images will be created, in 1024 x 1024, in batches of 1. The program having just undergone a major update, we had to replay all our cards, including the RTX 5000 series. The timing was too short to have time to retest them all, so it will be updated asap.
UL Procyon AI Text Generation:
The last benchmark added to this suite of tests, AI Text Generation. The Procyon AI Text Generation Benchmark offers a more compact and easier way to repeatedly and consistently test AI performance with multiple LLM AI models. UL claims to have worked closely with many AI software and hardware leaders to ensure that the benchmark tests take full advantage of the local AI gas pedal of the systems used.


Performance lags behind, as we’ve already noted, with NVIDIA models doing best in this benchmark.
V-Ray 6:
No graphics under V-Ray 6, as the benchmark is not compatible with AMD cards.
[nextpage title=”Gaming performance rasterization 1080p – 1440p: “]
Let’s get on with the gaming tests. We’ve used all the graphics cards we felt would be interesting to compare with this XFX Swift RX 9060 XT 16 GB in 1080p and 1440p definition. In the coming weeks, we’ll be bringing you a new type of article, retesting graphics cards from previous generations to find out what they’re still worth in 2025. Our panel of games currently comprises 13 titles, and will grow in the coming weeks. We’ve chosen to use the benchmarks built into these games. Why? Quite simply to enable you to compare your results with ours if you also own a copy of one of these games. It’s a thought-provoking idea, and one that will enable you to compare your results with ours. The number and titles selected have changed slightly, and will increase again in the coming weeks as we get our hands on new games.
What is rasterization?
Before we start, a word about “rasterization”, which is currently the talk of the town. Rasterization is the evaluation of the performance of our graphics cards without the use of upscaling technologies . We choose a graphics quality, often the highest, and test it. The advantage of these tests is that we can quantify the gain in architecture between different generations.
Borderlands 3 :


Let’s get on with the gaming part, starting with Borderlands 3. As we hinted in the introduction, 1080p definition should be a formality for our XFX Swift RX 9060 XT 16 GB. However, we decided to test it in 1080p to see what gains it made over the previous generation. If in 1080p, the RTX 5060 Ti 16 GB takes the lead, the opposite is true in 1440p, and this seems to confirm our first impressions, with an AMD model that could unleash the horses in 1440p.
Cyberpunk 2077:


The same applies to Cyberpunk 2077, where our XFX Swift RX 9060 XT 16 GB does better in 1440p than in 1080p. Despite this, of course, no difficulties in 1080p definition for this RX 9060 XT.
COD Modern Warfare III:


Our graphic takes on a different form as we know that the red maps do very well under Call Of Duty Modern Warfare III.
Forspoken:


Forspoken is a fairly demanding game, and our XFX Swift RX 9060 XT 16 GB achieves an average of 54 FPS in 1440p, the first time the 60 FPS mark hasn’t been reached.
Horizon Zeron Dawn Remastered:


One of the new games we’ve added to our comparison and for the second time, our XFX Swift RX 9060 XT 16 GB 16 GB achieves a very comfortable FPS average, and outperforms the RTX 5060 Ti 16 GB.
Shadow Of The Tomb Raider:


Under Shadow Of The Tomb Raider, it passes very easily, but it’s the greens that are out in front.
Black Myth: Wukong Benchmark Tool :


This game also seems to be very greedy, as our average drops to 38 FPS in 1440p and struggles to reach 60 FPS in 1080p. Graphics adjustments will be necessary for this game. Note that we made a mistake in our graphics and that the graphic definition is not “ultra”, but “cinema” in 1440p.
Far Cry 6:


Another game that’s all about reds, with the XFX Swift RX 9060 XT 16 GB taking the lead over its challenger of the day, the RTX 5060 Ti 16 GB.
Assassin’s Creed Mirage:


Well, you’re beginning to understand the song for our two definitions, no worries in 1080p, it’s a formality, and so far, it’s very easy in 1440p too.
Red Dead Redemption II:


Under Red Dead Redemption II, no changes, performance is spot on for the XFX Swift RX 9060 XT 16 GB.
F1 2024 :

Our sample of the day averages 77 FPS at 1440p. We haven’t yet had a chance to test our next three games in 1080p, which will be done in the coming weeks with the cards still available to us, as unfortunately we had to return several models to the brands.
Monster Hunter Wilds:

A new benchmark also makes its debut, with an average of 59.5 FPS in 1440p, just ahead of the RTX 5060 Ti 16 GB.
Alan Wake 2:

The last game, Alan Wake 2 won’t disturb our feelings, with here our XFX Swift RX 9060 XT 16 GB managing to exceed 60 FPS, with an average of 62 FPS.
Game average in 1080p and 1440p rasterization:


Let’s start with 1080p performance, which we won’t dwell on here, since our XFX Swift RX 9060 XT 16 GB is so dominant. It’s easy to see why this model is perfectly at home in the higher definition. Compared with the RTX 5060 Ti 16 GB, the difference is 2.2%. In 1440p, our XFX Swift RX 9060 XT 16 GB lags well behind the new reference in this definition, the RTX 5070 FE, but is just ahead of the RTX 5060 Ti 16 GB. However, what strikes us is the enormous difference with the RX 9070! We’ll see how we can reduce this gap even further with models with interesting overclocking margins.
[nextpage title=”Gaming performance 1440p upscaling:”]
In this section, we’ll test our graphics cards by activating ray tracing, if available, as well as upscaling depending on the graphics card used. As a reminder, there are currently three upscaling technologies . NVIDIA has DLSS, which can only be activated with NVIDIA cards. Depending on the generation of your GPU, you may or may not be able to benefit from all the technologies offered by the greens. If you’d like to find out more, we invite you to read this dossier. At AMD, it’s FSR, which is also evolving and, for certain games, also benefits from Frame Generation. At Intel, in-house upscaling is called XeSS, and with the arrival of this new generation of graphics cards, Intel has taken the opportunity to announce the arrival of XeSS 2, which will introduce two new features to compete with NVIDIA and AMD, who are already ahead in this field. Intel will be offering Xe Frame Generation (XeSS-FG) and XeSS Low Latency (XeLL). Finally, it’s important to point out that some games do not feature ray tracing, but only anupscaling solution. We’ll make this clear in the games below. For 1440p definition, upscaling, whether in DLSS or FSR, will always be in Performance mode.
Cyberpunk 2077:

Here we go again, with Cyberpunk 2077as our first game. Our NVIDIA cards are in front. Please note that, for comparative purposes, only Frame Generation x2 is used with RTX 5000s. Multi Frame Generation will be discussed on the next page. In 1440p, the XFX Swift RX 9060 XT 16 GB suffers with an average of 30.4 FPS when ray tracing is active, but rises to an average of 150.7 FPS with Frame Generation (x2). Mind you, if we had activated MFG, our card would have taken the lead at x3 and x4. We’ll tell you more about this on the next page, with a series of DLSS 4-compatible games. It’s important to keep this in mind.
COD Modern Warfare III:

No worries in Call Of Duty Modern Warfare III, where upscaling still allows you to gain FPS, and even many, many FPS. We’ll be coming back to the quality of the various upscaling options when several games feature FSR4/DLSS4.
Forspoken:

The same applies to our XFX Swift RX 9060 XT 16 GB: in rasterization, it passes under the 60 FPS mark, and upscaling boosts performance.
Horizon Zeron Dawn Remastered:

The same applies to Horizon Zeron Dawn Remastered, where Frame Generation achieves an average of 213 FPS.
Black Myth: Wukong Benchmark Tool :

Ah, here we go again with Black Myth: Wukong, a greedy game that benefits from ray tracing. And it’s in these very cases that upscaling is useful, but not sufficient. We’ll soon be acquiring a full license of the game, in order to test the benchmark with the various updates.
Far Cry 6:

No DLSS here, we’re using AMD upscaling, which explains the very low gain between DXR and upscalingmodes.
Assassin’s Creed Mirage:

The same applies to Assassin’s Creed Mirage: the XFX Swift RX 9060 XT 16 GB encounters no problems whatsoever.
F1 24 :

The penultimate game on our test panel, FSR Performance combined with Frame Generation enabled our model of the day to achieve an average of 213 FPS at 1440p.
Monster Hunter Wilds:

Ninth and final game, and same observation, with our sample of the day taking advantage of upscaling combined with Frame Generation.
What about upscaling with the XFX Swift RX 9060 XT 16 GB?
The XFX Swift RX 9060 XT 16 GB is already doing pretty well in upscaling, whether in 1080p or 1440p, with the exception of the game Black Myth: Wukong. Upscaling isn’t always necessary in 1440p, but it does provide a significant performance boost. As we’ve already hinted at several times in our previous tests, we’d recommend an average fairly close to 60 FPS before using Frame Generation, in order to maintain an optimal gaming experience and avoid the latency that could result. We received an MSI 240Hz QD-LED display, which will enable us to highlight this point in a forthcoming article.
[nextpage title=”Games that support DLSS 4:”]
A series of games are already compatible with DLSS 4, on the day of the RTX 5080/5090 launch. We were able to obtain them in order to begin a series of tests and highlight the performance achieved thanks to DLSS 4. We’ll be coming back to the qualitative side of rendering in detail in the coming weeks. Of course, the upscaling principle here will be to support our XFX Swift RX 9060 XT 16 GB face at 1440p performance with graphics options at maximum and ray tracing or path tracing if available. To measure our FPS, we had access to a beta version of CapFrameX v1.7.5. This measurement tool is certainly one of the best and most intuitive when the game doesn’t have an integrated benchmark. If you’re interested, we’ll be back with a detailed article on how to use it. We wanted to see how our PALIT RTX 5060 Ti Infinity 3 16 GB would perform with the Multi Frame Generation available for RTX 5000s.
Cyberpunk 2077:

First of all, with ray tracing in Overdrive mode , all cards suffer. In 1440p, the XFX Swift RX 9060 XT 16 GB averaged 13.4 FPS. There’s no FSR4 yet in Cyberpunk 2077, so it’s the RTX 5060 Ti that will take full advantage of DLSS4, but be careful. We advise you to turn down the graphics options to get a comfortable ray tracing average before activating the MFG.
Hogwarts Legacy: The Hogwarts Legacy

The same is true of Hogwarts Legacy, where in 1440p rasterization we manage to achieve an average of 41 FPS, which is already close to 60 FPS before the MFG is used. The greens still benefit from the MFG to take a comfortable lead.
Alan Wake 2:

The same applies to Alan Wake 2, with our cards suffering at maximum graphic options. We’ll have to be less greedy before resorting to MFG.
Star Wars Outlaws:

The feeling of going from 25 FPS to 116 FPS in 1440p for our sample of the day remains a sensation to be tested in game. The number of native and generated FPS seems to us to be very unbalanced. As you can see, we’ll have to look at the visual quality of the various upscaling options and the in-game feel with Frame Generation activated.
[nextpage title=”Overclocking the RX 9060 XT 16GB:”]
In our RTX 5060 Ti 16GB test, we had three models to review on launch day, so we weren’t able to test overclocking. That’s what we’ve done with this report, comparing the performance of our three models. So we’re going to evaluate the capabilities of our XFX Swift RX 9060 XT 16 GB when it comes to overclocking.
Power Limit, the RX 9000’s weakness?
Another key element to highlight is the ” Power Limit “, the box we’ve highlighted in GPU-Z’s ” Advanced” tab. But what is this Power Limit? Our XFX Swift RX 9060 XT 16 GB has a TDP of 180 watts, which means that when the card reaches this TDP, performance will be maximized. If the card were to exceed 180 watts when overclocking, it would automatically “throttle” itself in order to maintain its TDP, by lowering the frequency, for example, in order to stay within the limits. The margin offered by certain models allows this TDP to be exceeded. Our example of the day has +10%, i.e. the card can theoretically go up to 198 watts. If you’d like to visualize the Power Limit principle, we invite you to read our article on undervolting the ASUS TUF RX 9070 OC.
STEP 1: performance at original frequencies
We launch a first run under 3DMark Time Spy to see how the card behaves. The idea, of course, is to have a reference score to measure the gain throughout this overclocking session. We’ll start by keeping an eye on three values: the overall and GPU score obtained in Time Spy, the maximum frequency of our Boost frequency and the power consumption recorded in GPU-Z.
The overall score is 17269 points and the GPU score is 16864 points. The Boost frequency reaches a maximum of 3232 MHz and the GPU-Z TDP is 183 watts.
STEP 2: increase the power limit
This has been one of the new features of the last few years, and is also common to NVIDIA cards. Increasing the power limit provides additional margin for the graphics card. In this case, we’ve increased the power limit by 10%. We forgot to include the screen, but the gain is very small: the overall score is 17814 points (+ 3.1%), while the GPU score is 17071 points (+ 1.2%). Boost frequency reaches a maximum of 3292 MHz.
STEP 3: Overclocking proves ineffective…
Normally, once the power limit has been pushed to its maximum, the Boost frequency is increased in increments to achieve maximum stability. But here, with our RX 9060 XT, we’re quickly limited and instead of seeing a score that continues to improve, it regresses.
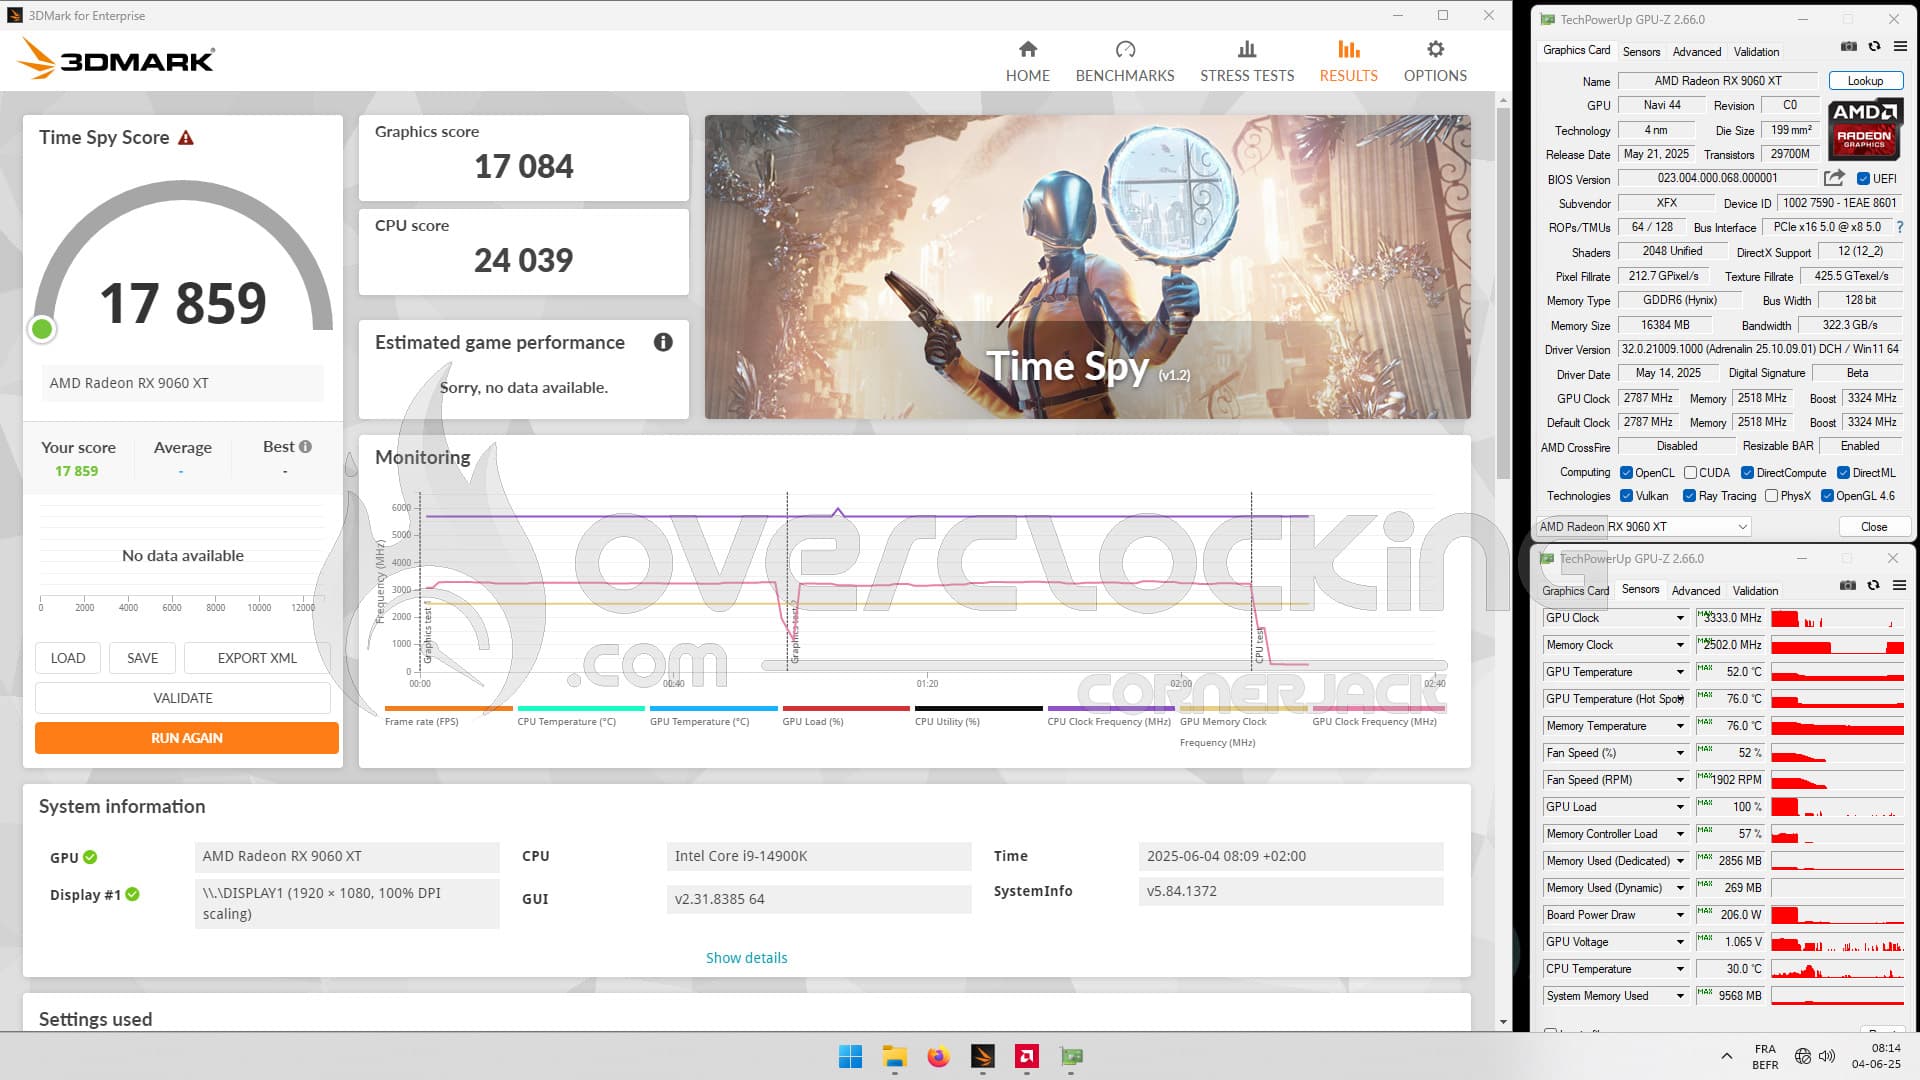
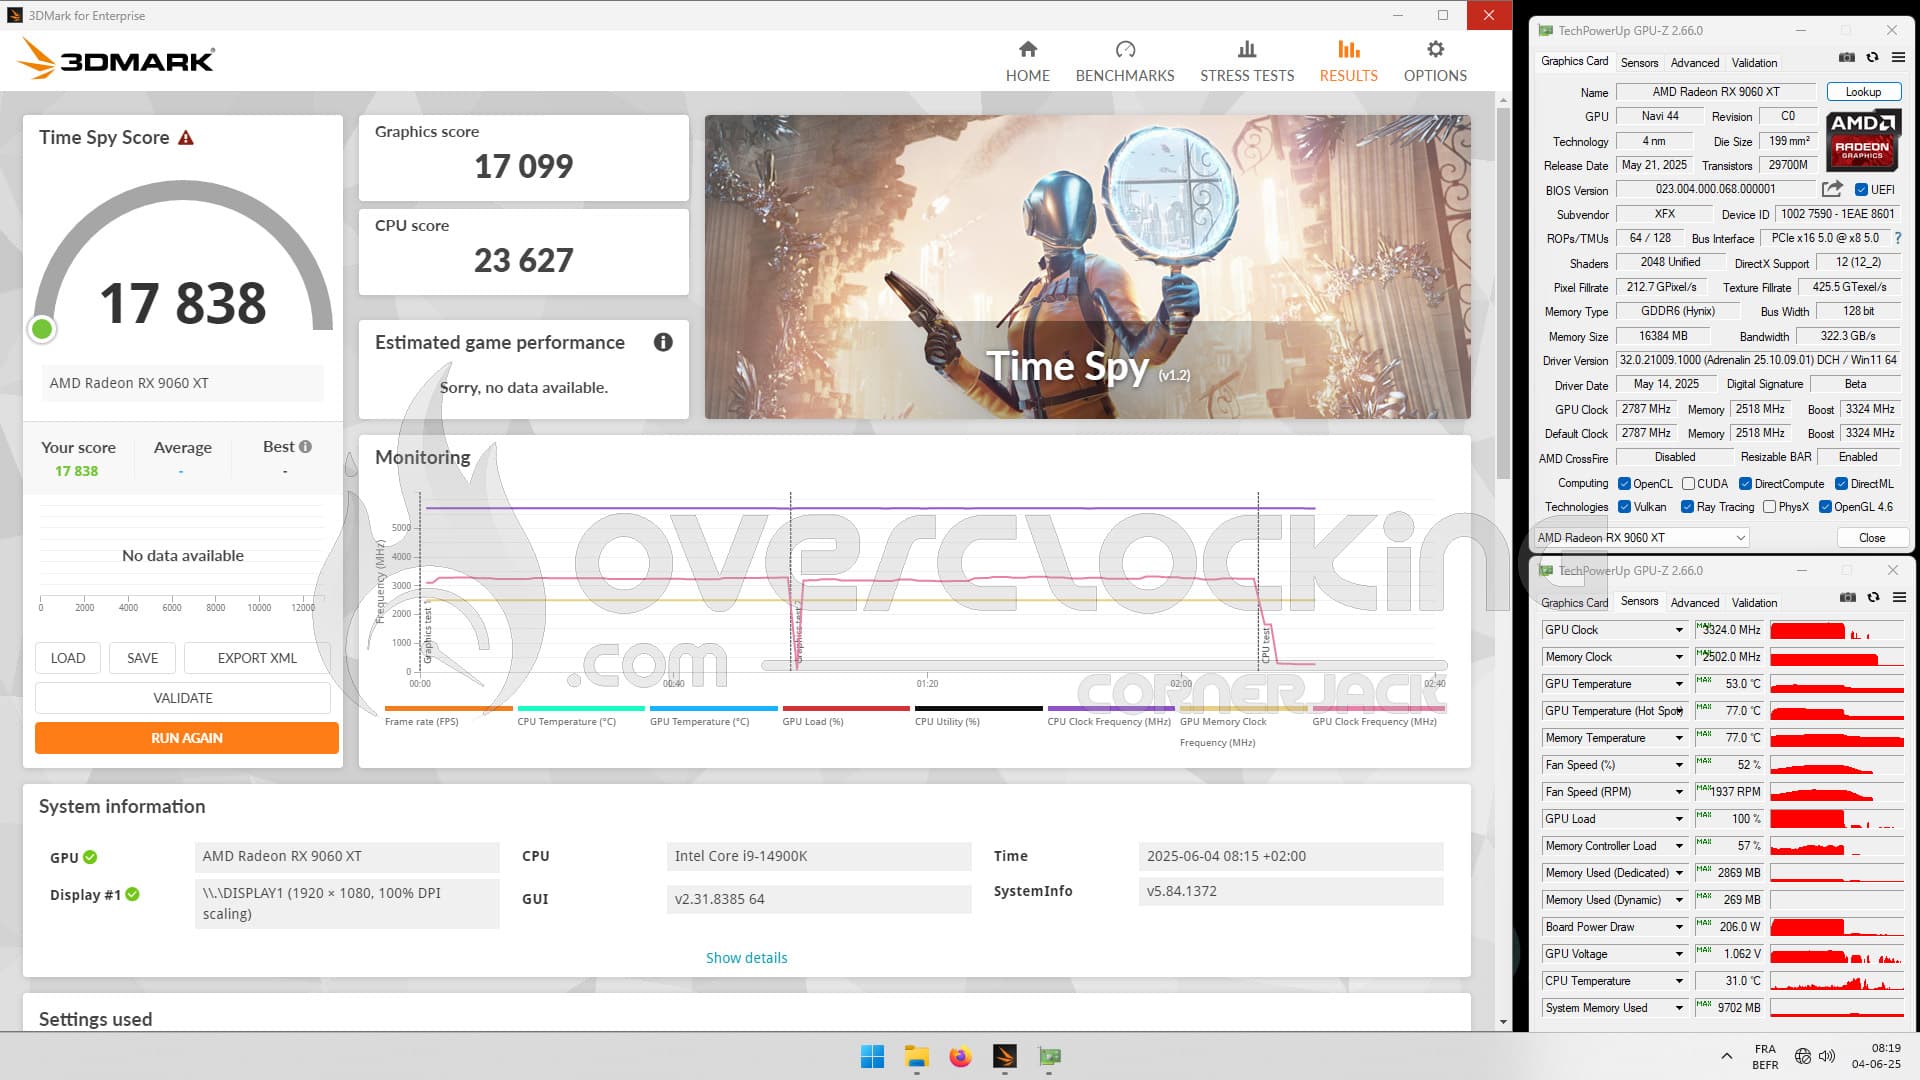
On the left, the capture with a 100 MHz increase in Boost frequency and on the right, a 200 MHz increase. The effect is non-existent.
STEP 4: Voltage reduction
Still using the AMD drivers, we lower the voltage, step by step, until we find the lowest voltage that still allows us to run our benchmark. If at any point our card runs out of juice, the benchmark will crash and we’ll know we’ve reached the voltage limits.
We were able to lower the voltage to -125 mV and thus improve our score. Our overall score is 18267 points (+ 3.6%) and the GPU score is 17600 points (+ 4.3%), but that’s nothing to get excited about!
STEP 4: memory overclocking
Another element we’ll be able to influence is the frequency of our GDDR6 memory. By default, it’s 2518 MHz, but logically, from experience, it should be at least 2800 MHz. For the record, memory clocked too high causes artifacts on the screen.
In the end, we were able to obtain an overall score of 19056 points, giving us a gain of 8% on our base score and 18454 points for the GPU, i.e. 9.4% better than the original. Maximum frequency is 3483 MHz and power consumption is 200 watts, with a voltage reduction of -140 mV. [nextpage title=”The final word:”]
So, what do we think of this XFX Swift RX 9060 XT 16 GB?
AMD’s answer to the RX 5060 Ti is here, and it’s more than convincing. As we said in that article, even if we haven’t tested an 8 GB model, we can only encourage you to opt for a 16 GB version, especially if you want to keep your card for several years. In terms of design, it features an 8-pin power connector, which may well appeal to those who don’t want to change power supplies and who own at least a 600 watt model. The cooling system is efficient, if rather noisy, but remember that the entire fairing is made entirely of plastic, although once inside your case, this will be of less importance. The full black side means you can match it with any motherboard. Now, as we pointed out at the end of our rasterization tests, what strikes us is the (too) wide gap between this RX 9060 XT 16 GB and the RX 9070 16 GB. Now, the price difference is there too, with an RX 9060 XT 16 GB and an MSRP of $349, while the RX 9070 16 GB sees itss at $549. If we make a rule of three concerning the “price/performance” ratio, we’re perfectly in line, so AMD is perfectly in tune with its pricing.
It’s out with the horses in 1440p:
While we were a little disappointed with the 1080p performance of the card compared to the RTX 5060 Ti 16 GB, it’s up to its old tricks in 1440p, matching the competition from NVIDIA. As with the RTX 5060 Ti, this card is perfectly suited to 1440p definition, and even ray tracing with the help of upscaling. Admittedly, you’ll sometimes have to make concessions in terms of graphics settings on some of the more demanding games, but overall, it’s a no-brainer. The two cards are therefore on an equal footing when it comes to rasterization.
The DLSS4 while waiting for the FSR4:
DLSS4 remains NVIDIA’s trump card for this RX 9060 XT. Unfortunately, the range of FSR4 games is not yet sufficient to reverse the trend. In fact, we’re eagerly awaiting the availability of several DLSS4/FSR4-compatible titles to make a more detailed comparison. Nevertheless, we stand by our opinion that NVIDIA’s MFG is better suited to high-end cards that already offer sufficient FPS natively. It’s a subject that’s far from over, and we’ll be back to it as soon as AMD’s catalog is complete. As we said, even if NVIDIA benefits from MFG on RTX 5000s, outside competitive games, there’s no point in having 250 FPS at MFG x4 if your game is perfectly playable at 120 FPS. So you have to be careful not to fall into the “DLSS 4, DLSS 4!, DLSS 4!! and DLSS 4!!!” trap. We think it’s a great performer, but it’s important to keep a critical eye.
Overclocking :
We’re sticking to the same principle as for the RX 9070 and RX 9070 XT: if you want to go up in frequency, you’re going to have to do some undervolting! We invite you to take a look at our dossier and the method we used to boost performance!
MSRP rates largely in favor of reds :
Okay, let’s get out the tweezers straight away. We’ve seen that this hasn’t always been the case over the last few months, and it’s true that reds benefit from a more attractive price, especially for identical performance. As always, it will be necessary to compare offers, compare prices, in order to opt for the best deal. As far as European prices are concerned, AMD has just announced a price of €319.90 for the 8 GB and €369.90 for the 16 GB. We’ll see if AMD is able to offer as attractive a range of cards as it did for the launch of the RX 9070 and RX 9070 XT. To conclude, we can say that AMD’s RX 9060 XT 16 GB offers an excellent alternative to the RTX 5060 Ti 16 GB, and above all, at a much more aggressive MSRP (-80 euros). If stocks last long enough, this could convince many potential buyers. All that remains is for AMD to rapidly offer FSR4 deployment in current and future games. In the end, it’s AMD’s aggressive pricing that has enabled it to move from a silver to a gold award. This week, we’ll be testing NVIDIA’s RTX 5060, which may find a rival in the coming weeks in the form of the RX 9060? Our thanks to AMD France for providing us with a copy of the XFX Swift RX 9060 XT 16 GB for this article.

