

This Monday, we have proposed you the test of the Intel Core i5-13500 which left us an excellent impression but this new Intel Core i5-13400F may also hurt or even very hurt the competition. As a reminder, these new non-K processors announced at CES 2023 are in direct competition with the AMD Ryzen 7000 non-X that we tested recently.
The price of this i5-13400F is $225 or 252 euros on Amazon but can be found in Germany at 222 euros! As you can see, it has an air cooling system , the Laminar RM1. It is always a plus to have a cooling solution in a bundle before investing in a cpu cooler or a more powerful AIO, in order to save some euros especially on a new configuration.

Thanks to Intel for making this sample available. We should also receive soon a sample of the Intel Core i9-13900KS in order to propose you the test too. So here we go for the test of this Intel Core i5-13400F processor.
[nextpage title=”Raptor Lake Architecture:”]
Intel keeps with Raptor Lake a “hybrid” architecture since it mixes two types of cores. We still find the P-Core and E-Core. We will see that on this 13th generation, Intel has doubled the number of E-Core. They have of course different roles. The first ones, the Performance ones , are designed to perform tasks requiring computing power and the second ones, the Efficient ones, for what is more similar to office automation or background tasks. Now, the two types of cores will work together according to the task requested. This is what we were able to highlight in our test of the i9-13900K and i5-13600K.
What about this i5-13400F?
For our processor of the day, the Intel Core i5-13400F, it’s a little different from the previous generation and therefore from the Intel Core i5-12400F.
Here are the characteristics of these two processors.
As we can see the differences between the i5-12400F and the i5-13400F are numerous with mainly the arrival of 4 E-core which did not have the i5-12400. The addition of these 4 extra cores, even though they are not performance cores, may boost the multithreaded performance.
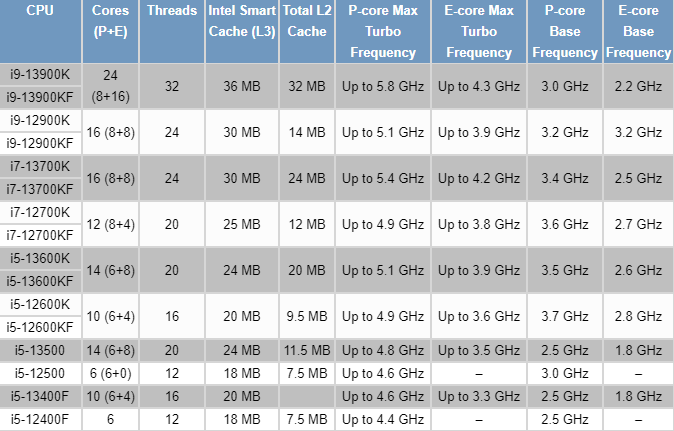
Here is the whole new range that was announced during CES 2023 by Intel.


On paper, this range of Intel Raptor Lake non-K processors seems very promising. As a reminder, the processors with the reference “K” or “KF” have an unlocked multiplier coefficient allowing to overclock the processor very easily. The i5-13400F that we are testing today has its coefficient blocked at 41.
We would also like to point out that to date, no card, whether from Asus, Gigabyte or MSI, is capable of overclocking non-K processors via the BCLK as some would have us believe.
Z790 and B760 chipset, retained LGA-1700 socket and backwards compatibility:
New processors mean new chipsets at Intel. At first, it is the Z790 chipset that has been launched. Good news because this one keeps the LGA-1700 socket and the backward compatibility. In other words, you will be able to use an i9-12900K on the Z790 chipset and conversely, an i9-13900K on the Z690 chipset. Intel will continue to support DDR4 on this chipset but this should be the last time since the switch will be made definitively to DDR5 in 2024.
The announcement of the new Intel processors at CES 2023 coincided with the announcement of the B760 chipset, which is an entry-level version that will be sold at a lower price than the Z790. We have also presented two ROG motherboards that will be tested in the coming days in gaming performance mode: the ROG B760 Gaming Wifi Strix-F DDR5 and Strix-A D4 DDR4.
[nextpage title=”Test configurations:”]
All the results you can discover in the following pages have just been updated during September. We have replayed all the processors at our disposal in order to have results realized with the latest BIOS from the manufacturers as well as the latest drivers especially for the chipset whether it is the Z690 or the X570.
The question of the memory kit:
Yep, which memory kit should we use for our comparative tests? This is a question we asked you on our Discord. Whether it is for DDR4 or DDR5, we are on memory kits composed of two 16 GB strips for a total of 32 GB. For our tests using DDR4, it is a Corsair Vengeance LPX kit clocked at 3733 MHz in 18-22-22-42. For the AMD platform in DDR4, the FCLK is 1866 MHz in order to keep a 1:1 ratio. The rest of the BIOS settings are in auto mode.
For DDR5 on the Z690 platform, we used our Teamgroup 6400 MT/s CL34 kit which we set to 6000 MT/s in 30-38-38-96. Why this choice? The kit delivered by AMD for the tests on the X670E chipset is a GSKill Trident Z5 NEO 6000 MT/s in 30-38-38-96. So we have two kits with almost identical performances on the two platforms AMD X670E and Intel Z690.
Here is a summary table of the four configurations we used for these comparative tests. Each test is of course carried out several times to ensure the accuracy of our results.

Finally, as far as the operating system is concerned, we chose Windows 11, which is the latest version 21H2 Build 22000.918. You should know that we noticed that for benchmarks, overall the results are always slightly better under Windows 10.
[nextpage title=”The frequencies reached: “]
As with every new test concerning processors, our first idea is to check if the announced frequencies are really reached. To do this, we will use the Cinebench R23 benchmark. Two cases will be used: a single core bench and a second one in multi core. The idea is to be able to judge the frequency reached and thus, to compare with what was announced by Intel in its slides.
Remember that the Boost frequency in bench is different depending on the processor. Be careful, as Intel points out, when we talk about Max Turbo frequency, it is the maximum frequency that can be reached by one of the processor’s cores executing a single-core workload(mono-thread). This frequency varies according to several factors: the load, the cooling system and therefore the temperature of your processor. This is a notion to keep in mind. Here are the frequencies we should reach on a single core during our run under Cinebench R23.
First step, we leave everything in AUTO in the BIOS except the XMP profile that we load in order to have a frequency of 6000 MT/s in 30-38-38-96 for our memory kit. We don’t make any other changes in the BIOS.
Test with the i5-13400F:
Here we go! In single core, we can see that several cores are alternating at a frequency of 4600 MHz which corresponds to what is announced by Intel. We can notice that the temperature of these cores is around 39/40°C.

When the 10 cores of our i5-13400F are solicited, the frequency is fixed on the P-Core at 4.1 GHz and at 3.3 GHz on the E-Core. As for the temperature of the hottest P-Core, it is 53°C and on the E-Core 46°C. Let’s not forget that we are equipped with a custom cooling loop of 480 mm.

Now that the i5-13400F processor is perfectly operational, we can start our comparative tests with peace of mind. We remind you the importance of this preliminary test which can reserve you some surprises as it was the case with the NZXT N7 Z790 whose test will be published this Friday.
[nextpage title=”Cinebench, Geekbench and CPUZ benchmarks:”]
Let’s start with a must-have processor benchmark, the Cinebench series. We chose Cinebench R15, the R20 version, which is also more and more used and finally Cinebench R23, the latest one. The scores will be given in Single core and Multi core. This means that the benchmark tests the performance on one of the processor’s cores and then on all the available cores.
To do this, we will use Benchmate which has just been updated to version 10.12.2 and can be downloaded here. The advantage of Benchmate is that it already contains a whole series of benchmarks and moreover, it is recognized and certified when you want to encode your results on the Hwbot site.
As a reminder, before you start reading these results, make sure you have a look at the previous page to understand the operating frequencies of this non-K i5-13400F.
Cinebench R15 Single Core and Multi Core:
A benchmark very much used especially by overclockers in order to be able to compare the performance of processors between them. It also allows you to judge the optimizations of your OS as well as your memory kit by setting a frequency and trying to score a maximum of points. Even if it is a little less used today with the arrival of R20 and R23, it remains a reference to compare CPUs between them since it is one of the first benchmarks used by the community.

We start with a score of 261 points which puts it far from the Ryzen 5 7600 and a hair more powerful than the 12400F of the previous generation. This benchmark is already getting old, but is still used in overclockingcompetitions.

In multi-threaded mode, the observation is different thanks to the 10 cores of this i5-1400F. It takes the lead over its rival of the day, the Ryzen 5 7600.
Cinebench R20 Single Core and Multi Core:
Cinebench R20 offers similar testing to the R15 version with SingleThread and MultiThread. Freshly landed in March 2019, it offers a more complex benchmark than the R15 version which had become a bit too easy for CPUs with many cores. Cinebench R20 requires eight times more computing power than the R15 version, and four times more memory. It can already be more like a stress benchmark since it forces your CPU to be stable for the duration of the bench.

Under Cinebench R20, the scores start to balance out and the gap with the Ryzen 5 7600 is smaller.

In multi-core, it is the number of cores that speaks once again. With a score of 6202 points, our processor of the day even manages to get the scalp of the Ryzen 5 7600X, which has higher operating frequencies than the Ryzen 5 7600. This is at the same time quite logical, thanks to the 4 E-cores of the i5-13400F.
Cinebench R23 Single Core and Multi Core:
How does this new version differ from the previous ones? First of all, it is more realistic when it comes to the score obtained depending on the processor used. As a reminder, Cinebench only test the capabilities of your processor in single-thread or multi-thread. But the main difference is to propose a benchmark which by default will last 10 minutes! The idea for MAXON with Cinebench R23 is to propose a benchmark that will allow a certain stability in terms of temperature and boost frequencies. We will test here the fast version.

The Cinebench are following and improving for our i5-13400F regarding the singlethreaded scores. The last one, Cinebench R23, is still in favor of the Ryzen 5 7600 with a score of 1851 points, which is 51 points higher than our i5-13400F.

In multi, same observation as for Cinebench R20, our i5-13400F obtains a score of 16211 points which places it in front of the Ryzen 5 7600X.
Geekbench 3.4.4 Single Core and Multi Core:
This is a benchmark available in several revisions, version 5 is more and more used in recent months and is also often used for CPU performance leaks. It allows to obtain two scores: one in single core and the other in multi core. The version used for the tests is 3.4.4 and 5.2.5. Please note that in order to take full advantage of these two benchmarks, a license is required and we perform the bench in 64-bit.

The trend we have noticed in Cinebench is confirmed in Geek Bench 3 with a single thread score lagging behind the Ryzen 7000(X).

In multi-threaded mode, the Raptor Lake processors manage to make the difference thanks to their E-core and it is therefore logical that our i5-13400F obtains a score of 47602 points which places it ahead of the Ryzen 5 7600.
GeekBench 5.2.5 Single Core and Multi Core :
The latest version of the GeekBench software, it is becoming more and more widespread and used by journalists. It allows, like the version above, to do memory and processor performance tests. We decided to add this additional benchmark but why? The CPU benchmark uses new tests that more closely simulate the tasks that processors face with recent applications. Geekbench 5 also increases the memory used in the benchmark to better reflect the impact of this parameter on the CPU results.

Doesn’t this sound like déjà vu? Well, yes, we can agree on the delay of our i5-13400F in terms of single-threaded performance against the competition of the reds.

In multi thread, the 10 cores, 6 P-core and 4 E-core, free the horses and our 13400F comes back in front of the Ryzen 5 7600X. The contribution of these efficient cores is a real advantage for Intel on recent benchmarks.
CPU-Z 17.01.64 benchmark in Single Thread and Multi Thread :
New benchmark that we have just added since it is increasingly used by brands in order to put forward the performance of the processor. To use it, nothing could be easier, just download the latest version of CPU-Z which is currently version 2.0.2. Then go to the “Bench” tab to check the performance in single and multi thread. The version of the benchmark that we used is 17.01.64.

As you can see, there are differences from one benchmark to another. Here with the integrated CPU-Z benchmark, our i5-13400F gets a score of 750 points which places it for the first time in single thread ahead of the Ryzen 7 7700!

Finally, we find a table that once again highlights the advantage of the mix of the two types of cores of our i5-13400F, which is still ahead of the Ryzen 5 7600X and its 8 cores and its higher operating frequencies.
[nextpage title=”Synthetic benchmarks:”]
Let’s start with a series of synthetic tests that we use regularly. We have opted for the CPU scores of the 3DMark benchmarks. The idea is to isolate only the CPU score by making a customtest.
Here are the results obtained in Fire Strike and Time Spy. In Fire Strike, whether it is for the “standard” or the “ultra” version, the physics test (CPU) is identical. Therefore, you will only find the score of Fire Strike. On the other hand, for Time Spy and Time Spy Extreme, the tests are different, so you will get both scores. These scores are very interesting for overclockers to choose the platform that will offer the best performance in order to break a maximum of records.
CPU score in Fire Strike:
Let’s start with 3DMark Fire Strike, which is one of the most widely used benchmarks today. It consists of two graphics tests, a CPU test and a fourth test that combines GPU and CPU. Don’t forget to disable the demo which doesn’t add anything to the final score and prolongs the benchmark(unnecessarily).

As far as CPU scores in 3DMark benchmarks are concerned, it is often the number of cores that will make the difference. The more cores there are, the higher the score should be. However, we also have to take into account the generation of the processors and the maximum frequency that these cores can reach when they are all used. We get a score of 28571 points but it is not enough to reach the result of the Ryzen 5 7600. As a reminder, the 13400F benchmarks on the six P cores at 4.1 GHz and on the four E cores at 3.3 GHz while the Ryzen 7 7000 benchmarks on its eight cores at 4.875 GHz.
CPU score at Time Spy:
The second test is 3DMark Time Spy. Although this one is done in 1440p, it has the particularity of using DirectX 12. It consists of two graphical tests and a CPU test. As for Fire Strike, don’t forget to disable the demo. These two first benchmarks are proposed by UL Benchmark.

Second CPU benchmark and our i5-13400F climbs in the ranking and comes close to the Ryzen 7 7700.
CPU score at Time Spy Extreme:
The second test is 3DMark Time Spy. Although this one is done in 2160p, it has the particularity of using DirectX 12. It consists of two graphical tests and a CPU test. As for Fire Strike, don’t forget to disable the demo.

On the “Extreme” version of Time Spy, the i5-13400F scores 5565 points and is once again ahead of the Ryzen 5 7600(X).
[nextpage title=”AIDA64 Benchmark: “]
So, for this test which will be done with the AIDA64 software, I will compare the two platforms, AMD and Intel, since I used the same kit at the same frequency and with the same timings.
AIDA has just seen its beta version evolve to 6.32.5659. It can be downloaded directly on the site but in order to benefit from all the results, you will need a license.
AIDA 64:
It is a software capable of providing you with a lot of information about your configuration but it has the particularity of having a memory benchmark. It will calculate the speed of reading, writing, copying and the latency of your memory kit. It is very often used to compare memory kits between them. It is an excellent tool if you want to compare the performance of your memory kit with those we have already had the opportunity to test. The version used for the tests is v6.75.6121 beta, the latest version at the time of starting the tests.

Where the Ryzen 7000(X) generation still suffers from memory bottlenecks, this is definitely not the case with Intel. Our i5-13400F is in an excellent position just behind the i5-12600K and the i5-13500.

In writing, same observation, our processor of the day keeps its sixth place in this ranking.

A table that does not change one iota with excellent read, write and copy speeds.

We end on a less positive note with a latency that is very high. You should know that by overclocking your memory kit, it is quite easy to go to around 55 n/s.
[nextpage title=”Power consumption: “]
As for the power consumption tests, we did not modify anything and we wanted to know how our configuration would react by default. Basically, we installed the CPU and loaded the XMP profile. Then we did our various readings and benchmarks.
Regarding the power consumption, we used the Cinebench R23 benchmark. We are here on multi thread. The idea is to measure the average consumption of our different processors. Be careful, this is a global consumption of the configuration. Currently, we are not yet able to measure independently and correctly the CPU consumption, but it is in progress. We still have some points to optimize in order to be fully convinced of the accuracy of our readings.

While the Ryzen 7000s left us with an excellent impression regarding their power consumption, our i5-13400F reached an average of 218.9 watts during a Cinebench R23 multithreaded run. On this point, AMD does much better but it is finally quite logical when we know that our i5-13400F actually has 10 cores. Despite a higher power consumption than the reds, we still find it perfectly acceptable.
Remember that this is the average power consumption of our configuration and that we only use the processor. Our NVIDIA RTX 3070 Ti is at rest during this benchmark where only the processor is used at 100%.
[nextpage title=”Overclocking: “]
Aaaaah, the overclocking… the point that is currently annoying when we know what the association of the 12 non-K generation and the B660/Z790 chipset was capable of.
Let’s try to be clear: currently no B760 or Z790 motherboard is capable of overclocking 13-generation non-K processors via the BCLK frequency and technically, it seems impossible unfortunately. As a reminder, a non-K processor like our i5-13400F has a locked multiplier and it is therefore impossible to increase it like on K processors. On the previous generation, some motherboards with a “special” BIOS were able to accept quite high BCLK.
Maybe this will change in the coming weeks but as we tell you, technically it seems very complicated. Asus’ in-house overclocker, safedisk, simply said: ” 13th non-K cpu bclk oc it’s impossible “, so it’s hard to be more clear.
Without this type of BIOS and a compatible motherboard (clockgen), the limit of the overclocking of the BCLK is around 102,5 MHz as shown in the picture below.

It is indeed a pity and we are the first ones to be disappointed but it is the policy of Intel on this series of processors. The advantage remains for AMD on these entry-level processors, which allows overclocking on these non-X Ryzen 7000. It remains to be seen if AMD can catch up with an equivalent Intel CPU with overclocking, but that’s the title of a future article.
[nextpage title=”The last word:”]
The most affordable last-generation 6-core processor:
Let’s start with a little reminder of the prices of competing processors, some of which have been lowered in price. On Amazon, our i5-13500 is priced at $ 300 or 290 euros, the Ryzen 5 7600 at $ 229 or 280 euros and the Ryzen 5 7600X at $ 249or 285 euros. What about the price of our i5-13400F? On Amazon, it is priced at $225 or 252 euros, thirty euros cheaper than its main rival in red.
Except in single-threaded tasks, our i5-13400F has no trouble getting rid of its opponent of the day, the Ryzen 5 7600, or even its big brother, the Ryzen 5 7600X.
The contribution of E-core :
The contribution of the 4 E-Core is a real plus compared to the i5-12400F of the previous generation. The performance is simply excellent for a processor that can be bought for 220 euros from our German colleagues. There is still one unknown about the gaming performance, but we thought it was so important and so much in demand that we decided to make it a separate review.
What about gaming performance?
Well, it remains to be seen if all the good things we think of this Intel Core 13400F are confirmed in our gaming review which will be available soon. In this one, we will offer you a comparison between two processors, this Intel Core i5-13400F and the AMD Ryzen 5 7600. As far as motherboards are concerned, we will use three of them. Three? Indeed, the Ryzen 5 7600 will be associated with a ROG B650E Strix-F in DDR5 and the i5-13400F will be combined with a ROF B760 Strix-F in DDR5 but also with a B760 Strix-F in DDR4 so that we can judge the difference in performance between a DDR4 and DDR5 version.
 This new Intel Core i5-13400F is an excellent processor with its 4 E-cores and is very efficient thanks to its excellent performance/price ratio since it is available in Germany for a price of 220 euros. It is for us an excellent choice for those who want to build a new configuration and who have a reduced budget. The i5-13500 is also a very good choice but almost 50 euros more expensive. So it will be interesting to watch regularly the discounts on these two models if you plan to build a new PC in the next days. Of course, we regret the absence of overclocking after having been able to try it on the previous generation. Thanks to Intel France for making this sample available and see you in a few days to discover our report dedicated to the latest generation of entry-level processors in gaming mode!