


Intel configuration test:
Of course, this kit will only be tested on an Intel platform as AMD does not currently have any motherboards supporting DDR5.
- Motherboard: ROG Maximus Z690 APEX (BIOS 0053)
- Processor: Intel i9-12900K Alder Lake
- Memory : 32 GB Teamgroup Delta RGB 6400 MT/s 40-40-40-84
- Graphics Card: NVIDIA RTX 3070 Founders Edition
- Cooling system : Optimus Foundation + 480 mm EK radiator
- SSD: Western Digital SN850 NVMe SSD M.2
- Power supply: be quiet! Dark Power PRO 12 1500w
- Operating system: Windows 10 64-bit


Aida 64 :
 This is a software capable of providing you with a lot of information about your configuration but which has the particularity of having a memory benchmark. It will calculate the speed of reading, writing, copying and the latency of your memory kit. It is very often used to compare memory kits between them. It is an excellent tool if you want to compare the performance of your memory kit with those we have already had the opportunity to test. The version used for the tests is 6.50.2812 beta and we have used the performance of the previously tested kits.

Boom, well the least we can say is that it starts very strong and it is logical. The “reading” score under AIDA64 is mainly influenced by the frequency. Here, our sample of the day with its 6400 MT/s is logically far ahead with a score of 101343 MB/s. As a reminder, our best score in DDR4 was 61325 MB/s with the Corsair Dominator Platinum at 4800 MT/s CL19. As usual with an Intel platform, you should therefore favour frequency and tight timings.

In writing, the same is true with speeds soaring to 87331 MB/s. For information, the Corsair Dominator Platinum 4800 MT/s CL19 in DDR4 obtained 67251 MB/s. Once again, we note a gap between the different frequencies.

As a copy, our Teamgroup Delta RGB 6400 MT/s kit sees its speed rise to 88832 MB/s, which is an excellent score considering our kit is still with its original settings. The findings are identical in copy. The Corsair Dominator Platinum 4800 MT/s CL19 in DDR4 had a copy speed of 57330 MB/s. As you can see, it is in reading and copying that DDR5 has a very large advantage over DDR4.

Finally, latency. This is where all eyes are on this value as DDR5 lags a bit behind although our kit once again manages to take the lead with 64.3 ns. Our best DDR4 kit in this game was the G.SKill Trident Z Royal Elite 4000 MT/S CL14 which achieved 41.4 ns. You will notice that the higher the DDR5 frequency the smaller this gap becomes. Note that a 3200 MT/S CL16 DDR4 kit has a latency of 50.3 ns.
Geekbench 3.4.4 :
 It is a benchmark available in several revisions, version 5 having just been released a few weeks ago. It allows you to obtain two scores: one in single and the other in multi. Using this benchmark, we are going to focus on the performance obtained on the ” Memory Multi-Core ” score, which allows us to differentiate memory performance. The version used for the tests is 3.4.4.

For the Geekbench 3 benchmark, despite the fact that our i9-12900K has a single core frequency of 5.2 GHz, there is a difference in score between the four memory kits. The difference between the 4800 MT/s kit and our 6400 MT/s is 280 points. For your information, in DDR4, our best kit was the G.SKill Trident Z Royal 4400 MT/S CL16 with 5617 points.

In multi-core, the gap between our kits is less important but it does not change our top three. We’ll be sure to share with you the results obtained on an MSI Z690 platform coupled with DDR4 very soon so that you can judge the differences.

As soon as we isolate the memory score, real differences are visible between the kits. Our kit of the day gets a score of 10662 points! This is the first DDR5 kit that manages to break the 10K barrier out of the box.
Geekbench 5.2.5 :
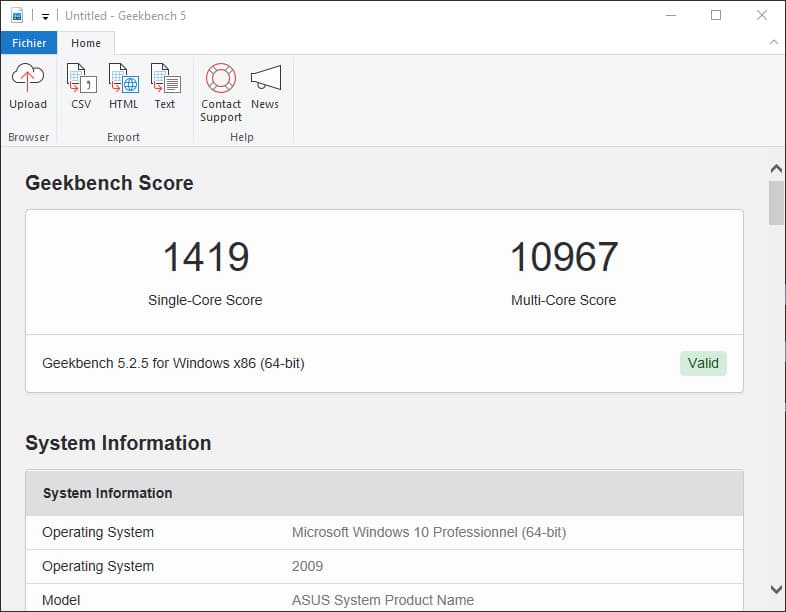 We decided to add this extra benchmark but why? The CPU benchmark uses new tests that more closely simulate the tasks that processors face in recent applications. Geekbench 5 also increases the memory used in the benchmark to better reflect the impact of this parameter on the CPU results. For now, we will keep both as version 3 is still widely used.

While in Geekbench 3 we had a difference in single core, here in version 5 the performance is almost identical and it’s still our sample of the day that takes the top spot.

Finally, the last score of our benchmark series with a total of 19259 points for our Teamgroup Delta RGB 6400 MT/S kit in 40-40-40-84. In short, as you can see, our sample of the day has simply achieved a flawless performance by taking first place in all our benchmarks.

